The Earth's Disappearing Cryosphere: Glaciers, Snow Cover, Floating Ice, and Permafrost
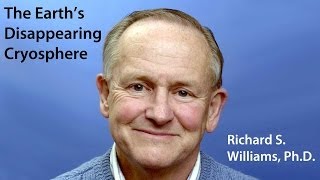
Dr. Richard Williams surveys how glaciers, sea ice, snow, and permafrost are vanishing across Greenland, Antarctica, and the Arctic. Rising CO2 and warming oceans are driving the collapse, with consequences for sea levels, coastal cities, and Arctic communities that depend on frozen ground.
Chapters
I'd like now to introduce tonight's speaker, Dr. Richard Williams, who I believe many of you know. He's going to talk about the Earth's disappearing cryosphere. He'll be discussing recent changes to sea ice, glaciers and permafrost and how that indicates large environmental changes occurring. Dr. Williams is an adjunct senior scientist here at the Center. He's also emeritus research geologist at USGS here in town. He has spent most of his career using airborne and satellite technology to understand dynamic geological processes, such as volcanoes and glaciers. And he's published more than 350 papers, books, books, chapters, and maps. And he has an ice stream, the Williams Ice Stream, and the Williams Glacier in Antarctica named after him.
So, Dr. Williams, thank you very much. Mike. Well, thank you all very much for coming. Yes, I see a lot of friendly faces in the audience, and that's appreciated, too. Having a glacier named after you under conditions of global warming is kind of a Pyrrhic victory, but it's all interrelated, and two things really spurred that. One was the Landsat program, which gave us the first medium resolution imagery of the planet so we could begin to document change like this research center does, dealing with forest and the changes that are going on in the forest, both in the tropical areas, the temperate areas, and also in the boreal forest. Satellite imagery allows you, with other data to show change that's going on, on, over time, these different phenomena. I focused in with the landsat back in 1972, when the spacecraft went up on July 23 with glaciers, and you'll see some of the work that I will be discussing tonight. This is based on a diagram that NASA put together in the Earth Observing System, which showed that you had a geosphere and a biosphere. Of course, the primary energy source is the sun, but the biosphere, which I'll get to in a moment, but I'm not going to dwell on that. That's mainly the work of this center. As you'll see, the geosphere is made up of the atmosphere, the solid Earth, the cryosphere, which is frozen water, and the hydrosphere, which is liquid water. Also, we're dealing with climatic processes, the hydrologic cycle, and, of course, the biogeochemical cycles that we see on Cape Cod, where we put too much nitrogen phosphate into the aquifers that begin to degrade our environment here. Now, you probably thought you were going to hear a lecture about forest, but not you're going to see lectures on glaciers tonight. However, I wanted to point out that it's also plants that are Changing very rapidly. This is the longleaf pine, Pinus species. And there were 90 million acres of this initially in the United States, is now down to 3 million. So even a huge forested area like that with these longleaf pines is also changed drastically in the North America. Let's look at probably the most iconic photograph, the Hasselblad photograph taken by a geologist, I might add. This was Jack Smith. He was a geologist with the U.S. geological Survey. Then he got into the scientist astronaut program and was the only scientist to walk on another body in the solar system, that is the moon. On Apollo 17, he took this picture on a nighttime launch with the Earth in the full disk. And it's really spectacular. NASA would never tell me who took this picture, but I finally cornered him at a lecture and I said, jack, who took the picture? He said, I did. He said, I wish he had a dollar for every time it had been printed. Of course, he went on to become a Republican senator from Arizona. And that's another story. One of the things that's driving a lot of what's changing on the planet's surface is the CO2. This was started in 1958 by Dave Keeling, now dead, who began measuring on Mauna Loa in Hawaii, which is my friend Jeff Williams stomping grounds, not the Big Island. He's mainly in Oahu, but he started these measurements. And even though it's always shown as a continuous record, it's not there in 1958 because a bureaucrat in Washington said, what in the hell are you measuring that for? So there is a gap. Anyway, in May 9th of this year, it reached 400 parts per million. At the end, at the beginning of the industrial era, it was 280 parts per million. And in a full glacial, it's 180 parts per million. So we've gone from 280, which was supposed to be basically the maximum in an interglacial, up to 400, by the way, in May of last year when I was in ICELAND, it hit 400 on their gauge, but it never made the news. This is a diagram that I tribbed from a Brown University professor and I just wanted to show you. What if we take a look at. Here's the last interglacial where it was warmer than obviously during a glacial, but he referred to a carbon dioxide induced superinterglacial. In other words, at this point in time we should be descending back into an ice age, another glacial period, but it's being delayed because of the activities of humans on this planet. And so we're going to go into a very much warmer interval with all kinds of ramifications, some of which I'm going to discuss this evening. I'm going to focus, as I said, on the cryosphere. Frozen water glaciers make up about 70% of the fresh water on the planet. Most of that ice, as we'll see, is in Antarctica. But the cryosphere can divide it, as I said, into glaciers, snow cover, floating ice and also permafrost. Where are the glaciers located? They're located on every continent except for Australia. There are actually glaciers still in Central Africa at very high mountain areas. The two largest glacier masses are two ice sheets, the Greenland ice sheet and the Antarctic ice sheet. And between the two of them they account for about 98% of the volume of glacier ice on the Earth. All of the other glaciers on the planet, if they were to melt, would only raise sea level half a meter, a little over one and a half feet. So to get the kind of inundation that's coming in our coastal areas and low lying islands is going to have to come from Antarctica or Greenland. And as you'll see, Greenland is showing very, very strong signs of melting at a very rapid rate. Let's just show a bar graph to show you that most of the ice, this is area, most of the ice is Antarctica, then Greenland. But the Canadian Arctic Islands are third in third place and Asia is in fourth, often referred to as the third Pole. But most of the ice as we'll see is locked up in Antarctica and Greenland. This is a map we did several years ago using NOAA AVHRR imagery. Landsat only goes to 81 north and south, so you have a hole over the poles, particularly Antarctica. So we use the AVHR image and got cloud free images over time to stitch together a really good mosaic image mosaic of Antarctica. The most interesting thing of Antarctica are its ice shelves, which I will discuss briefly. You have the Ronnie Filchner Ice Shelf. We'll take a look here at the Filchner in a few minutes. We have the Amory Ice Shelf, we have the Ross Ice Shelf. It's these shelves that are showing the greatest speed of failure right now. In other words, retreat. And a recent scientific report said that it's because of warmer ocean water coming in underneath these ice shelves. And they're melting at the rate of about 5 meters a year from the bottom up. So that's what's thinning these ice shelves. So what does that matter? If you remove the ice shelves, you remove the buttress of inland ice so there's no longer being held back. That ice will move into the ocean. Here's the Filchin Ice shelf back in 1973. You can see the Grand Chasms, which is a huge crevasse in the ice shelf that reforms and reforms and these break offs, these are called tabular icebergs, and they can be as large as the state of Rhode Island. We're talking about huge areas of ice that go north and eventually melt. At one time the Saudis thought maybe they could tow these to Saudi Arabia to provide fresh water. It didn't turn out to be too feasible. How much? Gee, that sounds like Everett Dirksen. He said a billion here and a billion there, and it starts to add up to real money. A billion dollars, huh? That's right. In fact, they had two reports on that. One of the things that we've been doing, in addition to the Glacier Atlas series, we've published 10 volumes out of 11. The synthesis volume just came out. One of the other things we've been doing is taking successive images of the coast of Antarctica, the cryospheric coast, which is either grounded ice or floating ice. This happens to be the Wordy ice shelf, which does not exist anymore. It's completely gone. And what we did was we looked at the oldest record from aerial photographs and then we worked our way in with satellite images. Until now, all you have left is essentially the coastline and the Woody Ice shelf is gone, as is mostly the Wilkins and also the northernmost part of the Larsen Ice Shelf on the Antarctic Peninsula. So we're seeing just extraordinary changes down there over short periods of time. Some of the work that we did in Antarctic Peninsula, you can see where Captain Cook got so far south and he actually made measurements where the edge of the shelf was. It is hundreds of kilometers from where it is right now. That was in the 1840s. Okay. The economist, as you well know, produces special sections from time to time. This one happened to be in June 2012, looking at the Arctic. And this is really a good picture of the melting, in this case of icebergs with fresh water going into the ocean. And you say, well, what's been going on in the Arctic over time? Well, this has been the trend down, but then look what happened here in the late 20th century. These are the actual records in the dark blue. And this is the estimates from proxy records up to here. And this is the long term. We're departing from what was supposed to be happening. And it's getting much, much warmer in the Arctic areas. And this has tremendous impact Particularly for the Greenland ice sheet because the warmth, as you'll see in a moment, speaking of the second largest ice sheet on the planet, this is the Greenland ice sheet. This is a normal projection. If you look at it in a Mercator, it's rather obese, which many maps show. But this is the actual shape, long linear shape. There is ice free land to the west and of course that's where the Norse settlers came from, Iceland. They had an eastern settlement and a western settlement. They were both on the west and some other ice free areas. This is from Jim Balog. You've seen extreme ice, you've seen some of the documentary films that he has produced with time lapse photography, eyewitness stand where that person is rather dangerous. These are enormous rivers that are flowing across the surface of the Greenland ice sheet and they eventually find an opening called a moulin in French word that goes right to the bottom of the ice sheet. And there are a lot of theoretical work going on right now. What happens when you take all that water on the surface and you put it at the bottom? Is that going to accelerate the motion of the ice out into the ocean? So we're going to have a greater loss. Some earlier work I did with the NASA Goddard people. Many of the people here at the center, myself included, worked with Goddard. Mike Coe has he worked with their land cover, land use science team, as I recall. Seems to me you gave a paper back in April. Working with the NASA people is really quite rewarding because they have access to data that's tough to get. This is from the gravity. The two gravity satellites are flying in tandem around the Earth and when they hit a stronger gravity pull, the lead satellite will drop and it will be further apart than the one that's following and that's measured and vice versa will happen. So we're able now, not me, but other scientists are able to show the increase in mass during the winter and then the loss of mass into the summer and fall. So you can see what's happening over Greenland. These are the melt, Dorothy hall and others myself where you see the red part of the graph. This is where we showed the increase in melt and decrease in melt as the season went on. Obviously it's at the end, at the melt season. There are a lot of new instruments out there that are extremely valuable scientifically and are giving us a lot of new data not only on Greenland but on Antarctica as well. Okay, what's going to happen to Greenland? Well, here's a modeling experiment in which this is what Greenland will look like with a 3 degree Celsius increase in temperature. That's within the range that the Intergovernmental Panel on Climate Change last assessment report said was ranged from 3, 3 to 6 or 3 to 7. This is 5 degrees. So there's very little ice left with 5 degrees. There's a lot of ice missing with 3 degrees and we're definitely going to 3 degrees and we probably will get to 5 degrees. So what happens if all the Greenland ice goes. You're talking 20 foot sea level rise. So all those FEMA charts you're looking at, whatever their accuracy might be, they're kind of way behind what's going on. This is the Batnoyukut ice cap in Iceland. It's the largest ice cap in Europe. And in Iceland of course covers about 10% of the land, has about 8,000 square kilometers. It has also got quite a few volcanoes that are located within it. And when these volcanoes erupt, there's tremendous outburst floods called eucalyptus that comes streaming out from underneath the glacier. The early Icelandic settlers didn't know that. They found out real quickly. By the way, the real estate is real cheap in this part of Iceland. We're going to take a look. Some of the early work I did on Landsat was taking a look at this outlet glacier here. It's called Ayiabakayikket. You have to take my word for it. It's like which the journalists, when that was erupting finally said that volcano in Iceland, they didn't want to try to pronounce it anymore. Anyway, this is an RBV image return beam vidicon image, which is not very well known by the scientific community. But there's lots of really good RBV images, 28 meter pixel resolution, which is comparable to the thematic mapper. This is Ayiabaka Yucate when it surged forward. And then this was a picture I took from a Cessna looking back at the broken up terminus of the glacier. This will stagnate for quite a while and then there'll be another surge, probably several, maybe 10, 20 years later. Nobody knows for sure what surge type glaciers. Interesting side story during the Bush administration where they weren't too thrilled with glaciers because they were too obvious. CO2, you can say, hey, it's gone up 30%. Yeah, you can't smell it, you can't see it, you can't taste it. Glaciers are pretty obvious what they're doing. So I had somebody from OSTP Office of Science Technology Policy called me up and said, hey, Dr. Williams, I understand, you know Something about glaciers. Well, a modicum here or there. And he said, can you give me a list of all the glaciers that are advancing? And this was after Michael Crichton had gone to the White House on State of Fear. And I said, whoa, yeah, sure, I can do that. Do you want a surge type glacier? Do you want a tidewater glacier? Or do you want a normal land based glacier? And the guy said, you mean there's more than one type of glacier? So I sent him a tutorial and I never heard from him again. This is the first glacier that was mapped in Iceland, Solheim Yucc Glacier. By the way, Yikit, which sounds tough to pronounce, probably you can pronounce it. The only other one in the room is the same word as our word icicle, etymologically the same. This is the Solheimajuk Outlet glacier. And it was advancing for most of the time I've worked in Iceland, which is approaching 50 years. But about 15 years ago it stopped advancing and began to retreat. This was in 1985 and this is in 2007. And it's pulled back quite a way so that now this river is running straight through rather than under the glacier. And when I took, when the Williams family went up to visit it, the terminus was right here. So if you go up on a bus now, you'll park here in a parking lot and then have to walk quite a ways to the terminus glacier. Every year it moves back, much like the Mendenhall Glacier is doing in Alaska. It's going back fast. Now you say, well, what is the relationship between temperature and glacier fluctuation? Well, fortunately, Iceland has some spectacular meteorological records, climatological over time. This was from the Stickiesholmer, excuse me, Marine Meteorological Station. And that's been operating since late 1800s. This however, goes from 1930 up to about 2007 or 2005. And you can see that as the temperature went down, the glacier advanced. When the temperature went up, the glacier began to lose ground. This is one of the best documented glaciers and temperature relationship that we have. Of course, we also have glaciers in other parts of the world, specifically South America, also in the Himalayas. We which are a big problem because they're primary source of water for many of the people in the mountain areas. And these are losing ground very quickly, as you'll see in the next slide from Lonnie Thompson. For those of you who have been here at the center for long enough. We went Tom and Ginny, we went to Patagonia on one of the sponsored trips with the Woods Hole Research Center. And we took a boat from here, went up to Uppsala Glacier up here, Estancia Christina, I think it was called. And then we went down to Perito Marino, which is one of these glaciers that moves forward and seals off the opening here. And so these lakes fill up until they burst the ice dam and you get another type of eukaloid. That was one of the great. Woods Hole Research center ought to do more trips like that. That was really something. This is Lonnie Thompson's sequence of photographs that he took on the Quelcaya ice cap in Peru. This is the outlet glacier here at Coracallis. This was in 1977, and he set up his camera station here in 2002. Exact same spot. And it's retreated back that far and it's losing ground every year very rapidly in the outlet glacier. There's no glacial lake here. It began to form and it's getting bigger and bigger as this glacier retreats. By the way, he's a master of doing ice cores in tropical ice caps. And if you look carefully, each one of these dark layers represents an annual layer because of dust on the surface at the end of the melt season. And he puts ice cores down through this, back from the edge and can get some very, very interesting data, very precise, even seasonal variability over time. Now, I just want to give you a quick tutorial on the difference between a mountain glacier, which many of you probably seen in an ice cap. If you take a glacier, you have an accumulation zone and an ablation zone at the end of the melt season. In other words, you have an area of the glacier that still has snow on it, and then you have very glacial ice below the equilibrium line. The same thing is true on an ice cap. Now, if that equilibrium line goes above the valley glacier, goes up valley, you're going to get the valley glacier to retreat and thin. If you get it above an ice cap, it's all in the ablation area. Now there's no more accumulation zone or area. Therefore, ice caps, ice sheets, are very metastable, that once you get to that tipping point above the ice surface, they go very rapidly. And that's a concern about Greenland, which is an ice cap, is sort of a miniature ice sheet. This shows you over time what has been happening in terms of the areas of the glaciers of the world. You notice since actually 1995, roughly every glacierized area in the planet is showing signs of loss. Now there are advancing glaciers, surge type, tide water, but those are exceptions to the rule, and they function on a different physical basis than a regular glacier. This is a really interesting curve that shows that at the beginning of the Holocene, or what some people are now calling the Anthropocene, we had agriculture emerge, we had a warmer period, then it got a little cooler, then it had warming. And that's when the Norse colonists, Eric the Red and his crowd, ended up in Greenland, sailed to North America. Hetland, Markland in Vinland. And there are two turf buildings at l' Anse aux Meadows in northern Newfoundland, which you can visit. It's a national park now, where they stayed for several years. But then the medieval warming was overtaken by the Little Ice age between the 15th and 18th centuries in Iceland, the Little Ice Age ended. Markland in Vinland. And there are two turf buildings at l' Anse Meadows in northern Newfoundland, which you can visit. It's a national park now, where they stayed for several years. But then the medieval warming was overtaken by the Little Ice age between the 15th and 18th centuries. In Iceland, the Little Ice Age ended about 1890. And then in the 20th century, the temperatures went up very rapidly in a global mean. And we're talking again, I've talked about this range was 2.4 to 6.4. So we're in the danger zone with respect to Greenland, even with this. And this was, I think, the fourth IPCC assessment report. What about sea level? That's the one that we notice most on Cape Cod. If you're paying attention, that is Jeff Williams, another Williams. You gotta watch it. There's a lot of us around. But Jeff just participated with some of the people here at a major conference earlier this week in Hyannis that was extremely successful in raising the visibility of what's happening on Cape Cod and the islands. By the way, There are about 200 islands on Cape Cod, but most people just refer to handful. Back in the 1800s, it was going up from proxy data about 8 millimeters per year. Then it got to 1.6 in the early part of the 20th century. Then at the latter part, it got to 3.2. It's now up to 4 millimeters per year. That's four pennies stacked up every year. And it seems to be accelerate. And this is again some of the projections from the instrumental data. And where we're going in the future, they're talking about at least a half a meter. That would be one and a half feet. But it's more likely a meter by the end of the 21st century. And it could be more depending on what happens to Greenland and perhaps parts of Antarctica. And then of course the National Geographic decided they'd do a special issue. Not completely, but there was a nice pullout section in there that I helped on as a person here with the Woods Hole Research center as to what really happens if you have all the ice melt, which it isn't going to do it next year. But if we keep going in the direction we are, there's going to be a lot of sea level rise. If all the ice would have melted, they estimate 216ft. That's actually higher than my house on Cape Cod and yours too probably. Greenland is good for 25ft if it were completely to disappear. So it's not going to happen right away, but that's the direction we're headed if we keep adding greenhouse gases to the atmosphere. Now what about places like Florida? This is from an American Geophysical Union article. This is a 6 meter sea level rise. Now just think of all those red areas. How much infrastructure is sitting within that inundation zone. Highways, airports, high rises, maybe even you own a condo within that red area. This is where we're headed. It even overruns this, what is it called? Okeechobee. The lake here and Cuba loses ground, better not own any. And of course there's another issue is people that are in low lying areas, particularly on islands, they kind of only can go to the coast. These people, high rises, maybe even you own a condo within that red area. This is where we're headed. It even overruns this, what is it called, Okeechobee. The lake here and Cuba loses ground. Better not are going to have to be resettled. And there are many, many parts of the world, particularly low lying delta areas like in Bangladesh, which culturally clash with the people to the west, particular Hindus versus Muslims, who is going to take in the umpteen tens of millions of people whose land is inundated. This is going to be a major issue way after we're gone. But the issue for the United States is that as the sea level goes up and as we get more severe storms because of a more active atmosphere, there's going to be more and more damage. So at what point like in New Orleans, do you relocate and not rebuild in the same place that's going to get flooded? Remember, the lowest parts of New Orleans are 28ft below sea level. So they already have a problem, as we knew. Okay, what happens if all the ice goes? Well, so much for Florida. So there'll be no more hanging chads, believe me. And you'll notice that Cuba is reduced to an archipelago, the Bahamas are long gone. And all your favorite places in Yucatan Peninsula are pretty well underwater as well. But again, we're not going to get to this. That would be all the ice would go. But the point is that think of all the airports and the infrastructure in the urban areas. In Boston, I mean even Boston, Logan, the water's lapping at your heels when you get on the airplane. The same thing is true of LaGuardia, even Newark, most of our major cities, airports are located right next to sea level. So we're talking about an enormous expenditure. And I predict that that budget for the United States to deal with public infrastructure is eventually going to rival what we spend for the Defense Department. And if you don't believe me, take a look at what the Netherlands had to do after the 1953 flood. The billions and billions in a small country had to invest to try to keep the North Sea out. And this was for Mike Coe. Fortunately his research area is in Serato. So it's mostly a savannah type environment. But this is what happens to the Amazon River. Of course it floods every year anyway to very high levels and the trees have adapted to it. But this is a much bigger problem in terms of how much inundation. Also Rio de la Plata. These are huge changes that can happen and they will happen in these areas. Not to this degree, but it will slowly encroach on these areas snow cover. I'll just touch on this briefly. Dorothy hall, my colleague at NASA Goddard. This is just a typical snow cover map in late, late winter. And then at the. And then here's just a peculiar very heavy snowfall that hit the Southern Alps in the south island of New Zealand. And then this is where this done at Rutgers University. And you can't see all of the different fluctuations here. These are seasonal. But you can see after 1995 or thereabouts, we're getting more and more departures in less and less snow seasonally. So there's a trend to less and less snow. And this is why it's so important to have these long term damages databases so you can understand what the natural variability is of a particular phenomena. So you can say this is what it was, this is what it is, this is how it deviates from that. A good example is the Arctic Ocean. This is the average sea ice concentration. It was about area about 5 to 7 million square kilometers for a 25 year period. And it shows you in March, which is the height of the sea ice season. In September you have that, that was what the norm was, this is how it deviates from that. A good example is the Arctic Ocean. This is the average sea ice concentration. It was about area, about 5 to 7 million. But then something happened very quickly. Before I get to the argument, square kilometers for a 25 year period. And it shows you in March, which is the height of the sea ice season in September, you have that. That was what the norm was. I wanted to say in the Arctic it varies from about. But then something happened very quickly. Before I get to the Arctic, I wanted to say in the Arctic it varies from about 3,000, no, 3, about 4 million square kilometers a year to about 15. In Antarctica it goes from 3 to 18 million square seasonally. And the sea ice around Antarctica is expanding slightly. Now, this is what happened in 2007. This is how the ice in the Arctic Ocean shrank. This is the normal, this is the low point, the blue, which was a 25 year average. And then in 2012 it even got less. This again is the average. And you can see there's wide open seaways for shipping. Last year Russia expected 40 ships to go through the Northeast Passage. This year they were expecting 400. Now this year it went back up about 50% from last year. And so that's a variability, a natural variability. It's still the sixth smallest sea ice area in the Arctic that we've been able to record. But some people have said, well, it must be cooling again. But this is the reason we have long term databases, so we can see what the truth really is. Okay, that leads to essentially the passages through there. We have the Northeast Passage, which is open, and we have the Northwest Passage. This is the Northeast Passage north of Siberia. And out in a much shorter distance. You're going through Canada, through the Canadian Arctic Islands and out. And more and more ships will be going through there. There'll be more and more infrastructure put in to support that ship traffic rescue operation. It's not very well mapped. I can probably ask Debbie Hutchinson about that. Not very well mapped. So you have to be real careful where you're sailing. One of the people at the Polish society meeting showed a cruise ship up here, right next to Greenland, sort of like the Costa Concordia. And remember that's been mapped since Roman times and this has never been mapped adequately. And who would bring a cruise ship full of all those people into a poorly charted water, lake, ice? This is another thing we could do from satellite images is we can see when the lake freezes up, when the lake breaks up. This happens to be a big lake. Great Slave Lake in the Northwest Territories, showing that as the ice is going out very quickly, from early May to late May into June. And so that's another thing we can document and produce records. Now for the last topic, which is probably the least known by most people in this room, except for those that are actually studying it. But permafrost is permanently frozen ground that covers an enormous area in Siberia in North America, Canada and Alaska. It also is underneath the ocean now. And being underneath the ocean is interesting because the water is 0 degrees Celsius, or 32 Fahrenheit. So that permafrost is already breaking down underneath the ocean because it's warm. And we see huge bubbles of methane coming up that are trapped under the sea ice and then are released during the summer. But we're also seeing a retreat of these isolated, sporadic, discontinuous zones. They're all retreating north. The tree line is going up, the tree line is moving north. There are just profound changes that are occurring in the Arctic, around the Arctic, and there is work going on here at the Woods Hole Research center, particularly in Siberia. Looking at some of these changes now, probably the biggest change is the concern to both the native people that live in these coastal villages that subsist on, in some cases, whaling, which they're allowed to do as part of their culture and fishing. This is what's happening to the coastline. We're talking about an ice bound coast. So it warms, it melts, the coast collapses. Then we have the problem of sea ice disappearing. So now the wave action is much more severe. And so the whole coast of Alaska facing to the north is under assault by melting and also by wave action. And this shows you a map. The numbers you see from 1 to 48 are measuring stations at one place on the coast. The maximum retreat is 17 meters per year. In other areas, there's different color codes. Here greater than four is, here, others the reds, there's very little. Usually they're delta areas where actually the sediment is building the coast out. But the changes up here are profound. And some of them are overrunning some of the oil drilling operations. In petroleum reserve area number four, which was set aside when the Navy converted from coal to oil. They wanted to make sure they had oil fields to supply the Navy. So there was one in northern Alaska. It's been drilled. But some of those drill holes now are being overrun by the retreating coast. Okay, if you're going to work on a permafrost, you have to get your buildings, your heated buildings and anything else up off the ground. So you won't alter the environment. Otherwise the house collapses or breaks up into pieces. Now, to get the taxpayers helped to build this Alyeska pipeline, oil depletion allowances, special everything. And so what was done with the oil coming from Prudhoe Bay to Valdez is that pipeline, which has got warm oil going through it, had to be put up on the pilings and suspended over the whole terrain to keep it from collapsing. That was expensive. And recently, or not recently, but the Chinese completed a railroad all the way to Tibet, and it's going over permafrost. So they put in what are called thermosyphons to make sure that the ground is not altered under the train track. So that's what these devices are, thermosyphons to try to keep the temperature in equilibrium. And then the last, next to last one. This is Katie Anthony. This is in Siberia, by the way. She poked a hole through the lake ice there. Methane escaped. And she was able. With her Zippo lighter or whatever else was able. I know, I'm dating myself, managed to get the. To ignite. And that takes us back to the planet Buckminster Fuller, before he ever actually saw this slide, that famous architect referred to the Earth as Spaceship Earth, which is a wonderful description of our planet. But this, I still think, is perhaps the iconic photograph of the space age of our planet, with Antarctica down here, the oceans, for instance, we call it Earth. It's not Earth, it's water. If you were coming here in a spaceship, you wouldn't say, oh, look at Earth. You'd say, hey, look, water. So we have the wrong name for this planet, but I think we're stuck with it. Saudi Arabia, the big desert areas, the Kalahari and the Sahara. To the north, you have the big tropical rainforest that some of the people here, like Nadine Laporte, are working on with the locals there and trying to deal with the deforestation problem, like Mike is doing with all the implications of deforestation in the Amazon basin and what that means. You're going to have to wait till October to hear about that. Is it 24th? Yeah, 24th. Don't miss Michael Coe's lecture. It'll be a good one. Anyway, that's. I'd like to wrap up just with that image focused in your mind as showing the changes that are occurring on our planet. Thank you.
More from Tod

WHRC's Sustainable Science Speaker Series - Dr. Toby McGrath speaks on Sustainable Fisheries