195_catchy_content_what_makes_tv_content_work_david_boyle_bbc_worldwide.mp4
David Boyle at BBC Worldwide built a metadata system to predict where British TV shows will sell across countries. They analyzed themes, mood, and dialogue sentiment from scripts, then tested which themes work where: political content bombs in the US but thrives in the UK, Russia, and Nordic markets. Older shows fetch lower prices everywhere.
Chapters
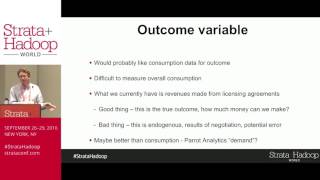
Thanks very much. So a little bit of a break from shipping and de icing of roads now to entertainment content, to TV content like the TV show Sherlock, which some of you I'm sure have seen, or Doctor who, We do. Or Top Gear. So I work at BBC Worldwide. We're the biggest distributor of TV content outside of Hollywood, so that's quite a big caveat there. But biggest outside of Hollywood. So we find homes around the world for hundreds of new TV shows every year. We have a catalog of thousands of TV shows going back many, many years and our job is to help them to find audiences around the world. So we get great British content from the BBC and we sell it to different content distributors all around the world. So we'll sell it to TV stations and online services like Netflix and Amazon. So every country in the world, our content is sold to and distributed directly to consumers by the companies. So this project is a little bit fun and it's a little bit early days as well. So is there a clicker is this. I'll just hit this. And it's a little bit early days as well. So you might say that this is a half baked project. It's very work in progress, probably does deserve some caveats and health warnings. But I want to show you how we think about this problem, how we're starting to think about this problem. I want to show you some of the business challenges that we're facing. I want to show you some of the analytical methods that we're starting to use. They're showing some already exciting results which I'll show you a little bit of. And then at the end, I want to end with a call to action. If you have ideas or, or solutions that you think might be useful for this problem, we'd be really interested in talking to you. So we're having fun with this. I hope you enjoy it today since I can work this out. Right, so take a TV show, something like Sherlock. What makes it catchy? What makes it work in different countries around the world? Well, you know, underlying what makes it successful is some magic, we believe some creative genius that made the show brilliant. But there are some other things beyond creativity and beyond genius that are easier to put into a database and run analysis on. So we want to gather some of those pieces of data and see if they help us to understand which shows are successful in which countries. So some ideas might be the kind of themes of the plot, different kind of ways the story goes, the different genres might be important, might not be in different countries. The kind of Gender and nationality of the actors might be important. Lots of our shows are British, with British actors of course, so there's a little bit of a bias to control for, but there's some variability there, the mood of the script. So we do everything from natural history to fast paced drama to very slow paced drama, emotions and tension as well. Maybe the reviews, maybe some shows are just better than others. So how many stars it got on IMDb maybe is an important predictor. And then the setting, maybe you know, the kind of geography it was set in. English countryside, English cities, or indeed in other cities around the world. So there's a lot of data that you might gather to understand what makes a show successful in a particular country around the world. And the main idea for us is that if we could gather some of this data for each show, because we don't have it right now, by the way, if we could gather some of this data for each of our shows and if we could store and analyze it, let's call that a genome for the content. If we had a genome for each content, could we use it to predict demand to take a new show from the UK and to say looking at the genome in this show, it should do very well in Germany, France, probably won't do very well in the us can we make predictions like that? Can we drive more efficiency from our sales and distribution network and finding homes for those shows? So which show should we offer in which countries? How much should we price that show for? It doesn't look like it's going to be very successful in America based on the genome. Maybe we should offer it more cheaply to start with, to more efficiently find it the best home. And maybe in the future even it can help us to decide which scripts or which shows to pick up and to produce as well. So first we've got to generate this genome. As I said, we don't have one, we don't have all this rich metadata on our shows. So how do we generate it? Well, there's some relatively simple data that we have in a database. So number of minutes that the program is probably somewhat important. Number of episodes in a season. A one episode show is very different from a ten part season. The rating that the show got might be really useful. So how many people watched it in its home, broadcast in the uk the first place it was shown before we then sold it other countries around the world, the genre of the show, that kind of thing. So we have some pretty basic data, but we want a lot more than that. We want richer data. We Think there's more descriptive data that we can use to help us to understand success. So we wanted to generate this genome, and there are two main partners we've worked with so far to give you, again, an illustration of the approach that we're taking and the way in which kind of data science can help. We think so. The first, we partnered with a company called Thoughtly. They're a small startup. They do use machine learning and text analytics to tease out from blocks of text meaning. And in our case, what they did was compared all of the synopses of our shows. So the brief descriptions of what each episode was about, they ran that through their algorithm and teased out a score on about 20 or 30 broad TV themes. So we'll come on and show you what some of those are in a minute and how they score. But things like technology or crime or family or romance, were they present in the script, in the synopses, and if so, how present was it to give us, for the first time, a sense of the topic areas each show touched on? We were quite excited about this one piece of learning is that it worked much better on the synopsis, which is an overview of what's in the episode, than it did on the scripts. Scripts contain quite a lot of statements and instructions that just actually aren't relevant to the viewer. So scripts need a lot of cleaning up before you can run them through something like this. Also, dialogue probably needs a lot of cleaning up as well. So some kind of complexities there about what data you feed in. We had a problem because quite a lot of our synopses are pretty brief, like a couple of sentences, which actually this worked pretty well. If we had longer synopses in the first place, or we could go get longer synopsis from somewhere else, this would be much richer. Again, but this is pretty helpful. The first time we'd seen this data, it was important for us. I'll show you what that looks like in a minute. Another important tool we used was a company called they say what we did there was to feed the script through, and they took all the dialogue from the script. And using similar analytical methods, they teased out the kind of sentiment or the kind of mood of each piece of dialogue. So they were able to score each show according to the mood of the script, which was really, really interesting and also a really useful piece of data for us. What we didn't do, but what we wanted to do was then to go get lots of data from other places on the Internet. There's tons of data about our TV Shows all over the place. For example, it would be pretty easy to go scrape IMDb to pick up more information on each of the actors, the gender, all the locations, things like that. Also the kind of scores that it got and the reviews and ratings. Some of that data adds additional complexity. So we didn't do it the first time round. Some of it's not available by country. So, for example, the number of stars that the show gets from an audience is only available at a global level. So we can't tell whether that was the German population really loving it and the French population not really liking it, or whether it was everybody in unison. So some challenges with that data, but a bigger challenge actually is. All right, well, what is the outcome variable that you're trying to predict, that you're trying to build an algorithm to predict? So this is not very easy. In the TV industry, the main outcome variable that people look at is the number of people who watch the show on a linear broadcast on regular telly. Companies like Nielsen measure that, which is lovely, but there's lots of things that don't go into that Nielsen measurement that are really important to us. For example, the number of people who watch the show on Netflix is really important, particularly if our sale is to Netflix and it's not measured in that number. So there's a load of data holes. Even if you did have that Nielsen equivalent number in every country, and we don't, anyway, we have it in about 17 countries we subscribe to that equivalent data set for, which leaves an awful lot of gaps in the world with no data. And Even in those 17 countries, it's a different database in every country, different proprietary methods of querying that database, different collection methods, and the data means different things in every country. So that was not a very productive route to go down. If what we're trying to do is something that scales pretty easily, is low cost and is nimble, which you'll see is a bit of a theme for this presentation. So that was the obvious outcome variable. We can't use that. We would probably like some outcome variable that captures consumption of our content, but we don't have that. Difficult to measure. What we do have, though, and what we've used so far is the revenue we got by selling that show in a country. So if we sold a show to a German broadcaster for $100,000, then $100,000 in Germany is our outcome variable for that show. There's an awful lot of complexity there as well. Was it an exclusive deal or is it sold to more than One person, is it the first or the second deal we've done? How long was the window of exclusivity we gave them? So we didn't get into any of that detail in the first stage of the analysis. We just took the first. The first sale price in each country at least we had an outcome variable for every show in every country. Yay. Simple pleasures in the real world of business. So, yeah, that was great because it was actually an outcome. That's what we're trying to, in many ways, what we're trying to optimize for. But the problem is there's lots of reasons why that's not a very good variable. For example, if nobody thinks in the industry, if nobody thinks that political shows do very well in America, we'll talk more about that in a minute. And nobody's going to try to sell political shows very hard in America. We're not going to pitch them very hard. And the buyers aren't going to want to buy political shows in America. Doesn't mean it wouldn't have been wildly successful. So there's a ton of biases in there. It's not really the ideal outcome variable, but as I say, at least we had one. And I would say seven times out of 10, when we try analytical projects like this, we end up without an outcome variable because we just don't have the data. So this is one of the ones that got through. I want to talk before we go on and show you some results. I want to talk about some of the other outcome variables that we could have used and that we're going to try in future. Some kind of generally applicable lessons here. One generally applicable lesson in absolutely every industry, of course, is to use Google Trends data for our shows in individual countries at particular moments in time when we sold that show, which would be a pretty simple, pretty powerful data set to use. Unfortunately, we know from tons of playing with this data that, yes, it's very helpful, but it has immense caveats that mean it's too reactive to demand or too reactive to the moment to fairly represent underlying demand. And luckily for us, there's a company that have taken that into account and factored in lots of other data sets to build models that predict underlying demand. And our next phase of analytics is to use this data instead as an outcome variable. So instead of using Google Trend, which is free and accessible, we're going to switch to using Para analytics, who I'm really excited about. What they do is to take lots of digital signals that are available these days. They look at TV shows, you could do the same for lots of other industries. All these digital signals in our case like YouTube views for related content, Wikipedia page views for that show, Facebook posts and comments and likes and follows, and Twitter the equivalent. All these digital data sources that are freely available now gathered at scale as locally as possible, so by city or by country around the world and then teasing out from that what the underlying demand is. And it's infinitely cleverer than the Google Trends work which we've used sometimes and as I say it's been helpful. But there's always very strange things that happen with Google Trends where there's a huge spike in demand and you just don't see it in the real world. And para analytics, and they're some of their kind of smoothing and weighting algorithms, take that into account and give you a much more predictive demand metric which is much more predictive of what happens in the real world. So our next version of the project is going to use this as our outcome variable. But in the meantime we're using sale how much we sold a show for in a particular country. So finally we end up with a data set. We've got something like 500 seasons of technology of television in our data data set that we've actually sold or done deals on in the last few years, plus some other criteria of countries that we wanted to look at, that kind of thing. Something like 20 countries we ended up focusing on to give us a more manageable data set and again revenues from licensing deals country by country. At the season level, this is another decision you have to make. Are you doing at the brand level across all seasons of a show? Are you doing this at the season level? Are you doing this at the episode level? So we're doing this at the season level for this analysis and of course the genome of the show, taking some basic metadata, plus the thoughtly work that teases out plot themes, plus the they say work which teases out that moods in the script. Right, well, what are we going to do with it? We've got this great data set which as I say for most problems we try to tackle, we can't build. In this case we've built this great data set. Data set. We would like to predict the overall popularity of a show based on the genome elements of the show. Something like the mythical story of how Netflix commissioned House of Cards, which by the way is based on a brilliant BBC original show. If you haven't seen it, I'd recommend looking it up on Netflix as well. Fantastic story. So we'd like to do something like that by looking at the genome predicting popularity of a show. But as I said before, we think there's a lot more to it than that. We think there's magic in there. In the house of cards, yes, it was based on a brilliant original show by the BBC. Yes, there were some great actors and production talent. But it's more than just the genome. There's some magic which made that show absolutely fantastic and really compelling. So the genome alone is not sufficient. So instead what we want to do is predict which genome elements over or under perform in individual countries. So not saying how much should this show be solved for or will this show be a success or not, that feels too ambitious right now. Step one, let's just analyze which elements of the genome in which countries over or underperform. What this allows us to do is to demean the data by show. So each show has a different amount of magic and sells for a different amount will bring each show back to the average in terms of sales. So demeaning by show and also each country's different. So we'll demean the data by country and then we can just identify which genome elements over or under index in a particular country. Technically, what this means and how we did this was a fixed effects regression with both season fixed effects and country fixed effects. I'm not going to speak too much about the technical side of this. There's an economics professor we worked with who's at Chapman University who leads all of the analytical work for us. So I'm the kind of business guy and maybe the data guy and he's the analytics guy. And then as you can see, we have thoughtly and they say as partners on bringing kind of AI type approaches to gathering data. So a real coalition to get this project together. So let's take a look at some of the sample learnings. And I said in particular I would mention politics because there is a rule of thumb in Hollywood, if you ask the TV companies in Hollywood, since the West Wing politics doesn't work on American tv, House of Cards being another exception. There are lots of exceptions to every rule. And sure enough, when you control for the shows and you control for the countries, our analysis showed that politics as a theme was underperformed in America. So we colored that one red and in the UK and politics over performs like it's more popular in like Russia and the Nordic countries. So some interesting patterns emerging of where individual themes are more popular or where they're less popular. And most importantly, some themes that actually gel with some of the perceived wisdom that's out there. So we might be onto something. This data might be working, might be telling us something. There are quite a few other pieces of analysis that gel with real world experience as well. So there's a lot of other variables at a show level that we control for, for example, how old the show is. And when you run the analysis, sure enough, the age of the show decreases the sales value of the show. It's good. It's kind of obvious, comes out of the model that way, though. So that's good. And even better than that, the age of the show, as it gets older and older, the age has less impact in the model. So that makes sense as well. It falls off a cliff to start with, and then once it's old, it's old. Doesn't matter how old it is. Kind of makes sense as well. So there's a lot of very intuitive things that come out of the model. A lot of the variables go in the right direction and have the magnitude that you might expect. It looks like it's probably working. Simple wins here, guys. Simple wins. And then if you take a look at individual countries, you get a story that I think is pretty interesting as well. So if we take a look here at Italy, there's quite a few variables that statistically over perform in Italy, and a number of variables statistically underperform. There are a lot of other variables that we can't rate because they weren't statistically significant. So maybe there weren't enough shows that had that variable that sold in Italy over that period. So there's a little bit of work here before we get to the outcome. So in Italy, variables that work well are fear, technology, law, action, family, music, fantasy, and sci fi. So a mixture of themes and moods there, and themes or moods that don't work or that underperform in Italy are romance, people and culture, surprise and business. Now, it might be slightly counterintuitive to say in Italy, romance and people and culture underperform. It's not what we think of as Italians, is it? But you got to remember, this is British content we're talking about here. So what we're really saying is maybe British romance isn't quite romance enough for the Italians. Then it kind of makes sense. I don't know. So again, this is roughly where we're at, right? So we've done this data, we've run it and done this kind of analysis. So for each country, we have something like this. For each plot theme, we have something like this kind of makes sense. We're in the middle of sense checking it with the business. What conclusions can we draw from that? Well, I mean the first, so simple but incredibly important is that this seems like it's working, right? There's something here. We didn't have this data before, we now have at least some of it and it's telling us something. Yay. This is important data. We should be gathering it, we should be using it. Having said that for sure, it could do with a little bit of fine tuning. I mean as I said, this was quick, this was very low cost collaborative effort and it worked brilliantly. But there's so much more we could do. And one question I want to ask you in a minute. We're going to have a lot of time for questions. Hope you've got some. One question I want to ask you in a minute is what other data science approaches do you think might apply to this problem? And I'll give you a few ideas to get the conversation started. For sure, the outcome variable needs some work. It's good that it worked on the content sales revenue, but again we're going to switch to this para analytics demand score which I think is much better predictor of an outcome that we're looking for than the sale revenue. But we'll see and we'll see where that works and where it doesn't. Still a lot to think about in methodology, what we control for and what we're targeting in the analysis. So again, we're at early stages there as well. But yeah, we have learned a lot from this and it's either clarified things that we thought we knew. So the politics thing in the US does seem to be actually happening and it's taught us some new things that we didn't know but that sound like they're sensible conclusions. So we feel like we're already moving forward as a business and then really as I said before, I wanted to open this up for discussion. You get a sense, I think of us and our approach, our problem and there's tons of other ways that skills lying in this room or outside of this room could be used to help with this problem. I'm quite sure. I think there's two big buckets in my mind that we don't know a lot about and that I imagine a rich opportunity. So the first is obviously on the data generation side, like what other genome elements might we generate for each show or gather for each show? There's a ton of nice ideas here. So you could analyze the frame by frame of the videos and by looking at when the scene changes or the movement in each still, you could get a sense of the pace. That would be pretty cool. I bet that's important. If you looked at the color palette in each frame, maybe you could get a sense of something like tone, warm versus cold. Maybe something there. So there's a ton of kind of video analytics options I'm sure would be really, really productive. Veins. Object recognition would be a really fun one to look at. So how much of a presence are there of guns in this episode? How much of a presence are there of swords? I don't know. Crowns. I think that'd be a really fun one. Maybe place recognition. You could look at facial expressions by scene to get a better sense of emotions and maybe the emotional arc throughout an episode or through a season. That'd be kind of fun. Bet that's possible relatively easily. So there's a ton of stuff on the content genome side I think would be really useful. I bet there's some quick wins there. On the other side then we use this fixed effects regression which has been pretty helpful and it's telling us a lot. I bet there's more interesting, more sophisticated analytical methods that we could use. Would love any advice on that. That's a big blank for me. But I know they're there, I just don't know what they are. And then it's important to. The important caveat before we have a discussion about that is that we're most interested in like two way partnerships. So if you would like us to write you a big check, it's probably not worth putting your hand up. But if you're interested in trying out technologies or you know someone who's interested in trying out new technologies in partnership with the BBC, where at the end of it we can talk about press release and showcase the work we did together, I think that's much more interesting than straight up commercial relationships. But yeah, we think this is a really interesting problem. Most entertainment companies haven't tackled this yet. We're somewhat at the cutting edge for getting even this far. And it's a bit rough, isn't it? We think there's loads more opportunity here. We're excited to keep pushing this project forward and would love any kind of questions, ideas or input that you. So the question was, does Netflix provide data on kind of viewing completion, stop starts, that kind of thing? So the simple answer is that Netflix don't provide almost any data to us. So no. And I think that's one of the problems we face, which is why the Outcome variable is so hard. Here is that most places we sell our content to, whether you're a TV station or a digital platform of any kind, most places don't give back meaningful data to us. We're pretty much without relationship. We don't have the relationship with consumers and we don't have that data. I previously worked in book publishing and before that in the music industry. It's basically the same story everywhere. In entertainment, you don't get that, so you have to proxy for it. Which is why something like Para analytics is really exciting. It suddenly is available everywhere, country, every show. Even though it's a proxy, it at least exists. It's a pretty good one. So no, unfortunately not. If you were a single platform like Netflix, you have your own outcome variables. This is a lot easier problem to solve. We don't have the outcome variables, so it's a lot lot trickier for. So the question is, do we look at commercials and the impact of commercials in programs? The quick answer is no. In the uk we don't broadcast commercials. We're completely ad free. And every time we sell a show to a different person, to a different broadcast from a different country around the world, they treat that show very, very differently. So they might do that at the broadcast level. We're more of a distribution business at heart. So no, unfortunately not. That would be a nice problem though. Sorry, I'm not very good at this at the back and then we'll come over here. So the question is, how did we combine the data? Well, it's a manageable data set. There's only 500 seasons of data each with, I'm guessing, kind of 50 data elements for each show. So relatively simply is how we combine them at the moment. But if we were to include the video content and the audio content and the subtitle content and all sorts of other stuff, we might have a data storage and management problem. But we've tried to keep the problem simple so that we don't have an engineering challenge. At least that's one thing we've saved at the moment. Like to hear your opinion about analytics. Great. So the question is, will data analytics deteriorate the quality of content as we make. As we manufacture. Manufacture content by algorithm instead of using creativity? Excuse me. The answer is, for some people, yes, and for some people, no. When I worked in the music industry, for example, I was at EMI Music, and we use analytics across artists and songs and albums and countries to make a fantastic difference. But it was very, very, very clear that creative decisions were to be taken by creative people and they were risks that they were empowered to take. If the data said, don't do that, you could still make that bet if you wanted to and try to beat the market. So I think some companies at their heart are creative businesses and data helps them. There will not be a problem at all. And I don't think that they will suffer from making average products to order. Some businesses at heart are 100% commercial entities designed to optimize, and creativity is a tool by which they generate revenues and they will control that creativity using data, and they will suffer creatively, maybe not financially as a result. So I think it depends on the business and the BBC is a creative enterprise at heart, so it doesn't worry me and my business today. One more question. So different, different companies provide different data to us. So Netflix do give us a little bit of data on total views of our content and Amazon do something similar. So very simple data at a high level for each show. But every service provides something different. Nobody provides meaningful data. I would say unlike the music industry where Spotify and itunes both provide very, very meaningful data, allowing you to rich to understand in a very rich way how people were consuming your content. No aggregate numbers per episode. Yeah. So no, we're data poor. Ideas and content rich and data poor. Any help with that would be greatly appreciated. Thank you. Thanks very much.
More from David



How Can ChatGPT & AI Help You Make Your Business Better? - Guest: Marketing Strategist, David Boyle
youBEAT Cafè - Prompt for Artists / AI Revolution / ChatGPT with David Boyle (Audience Strategies)

Now that's Significant - Ep 52 - Reimagining the Future of Marketing with AI - David Boyle