Data is the New Oil and We Need Researchers to Clean the Spill - David Boyle at TMRE, 2015

David Boyle argues that raw data is useless without distillation into actionable insights. He uses music, TV, and publishing examples to show how guided visualizations and human judgment paired with machines beat either alone.
Chapters
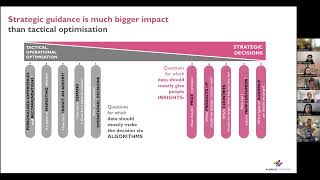
This is going to be a perspective on big data. It's going to be a perspective on big data from, from the market research world, which makes sense given where we are. And it's going to cover some really important lessons I think we need to keep in mind when working with big data. Maybe some advice for how to work with big data and I think also some advice that you can pass on to big data colleagues who are working on big data, even if it's not you. Because there are some ways in which, let's stop calling it big data. There are some ways in which data, science or non research data get used. It's not that helpful actually. And there's some ways it's used that actually is unhelpful. And I think this tries to mitigate against that and tries to bring it into the fold and tries to leverage market research expertise in the kind of data science world as well. So I mean, the background being the obvious, that big data data is absolutely everywhere nowadays. Everything every consumer does practically generates data and that everybody in every organization has data at their fingertips now. It just wasn't the case a few years ago. So whether you're in the social media team and you've got streams of KPI dashboards and reports coming at you from everything you do, whether you're in supply chain and you've got supply chain data now, suddenly real time on your desk, whether you're in, I don't know, operations or shipping or consumer satisfaction doesn't matter, Right? Data is absolutely everywhere. So you might assume therefore that organizations are using that data to great effect. The teams are using it brilliantly. And I think kind of interesting perspective on this is to step back and think about the really important decisions that an organization makes. And you know, I come from the entertainment industry, music and book publishing and television industry now. And if you look at the really, really important decisions in those industries, they're still not being made using data. They're still largely being made by gut instinct or skills and judgment as you might more enthusiastically call it. So we've got this huge challenge which is that there is this mass of data, but core decisions in many organizations are still being made in exactly the same way. So how do we take that mass of data and help it to be useful in decision making? The answer is that it's about a lot more than what you do with the data. Of course you can do great stuff with the data. Still, people still aren't going to use it. You failed. So we're going to cover a lot More than just data tools in this. In this talk as well. So, yeah, my background is currently in the TV kind of production, distribution, TV channels business around the world for that, book publishing and the music industry. So I'm going to talk particularly about lessons I've learned in those industries. And for me, one of the key lessons is that whatever data you're working on, you need to drive it towards what's genuinely an insight. And for me, that means something that people can keep in their heads as they walk around the building during the day, something that they can draw on without having to look back and remember what the number was on top of that graph without having to call up a report on their desk. The better you can drive towards genuine insights that people can carry around, the more successful you're going to be. Again, whatever data set it is. But most data sets don't do this, most analytics doesn't do this, doesn't try to do this. Even so, it sounds blazingly obvious, but at the same time, actually, that's not what's on our mind. One example of that in action, one lesson or recommendation, one illustration also of why you need to do it, is segmenting consumers. Clustering consumers, you might call it. So, as researchers, of course, we've been doing this for quite a long time. It's completely obvious to us that you should segment a population of people because different segments have very different behaviors, they have very different wants and needs. And if you look at the average consumer, you make pretty terrible decisions. But if you look at different groups of consumers, boy, can you tease out fascinating stories and recommendations. So an obvious lesson for market researchers is that you should segment data. An illustration of that in action, which I've shown a few times this week, is beautifully simple and incredibly powerful, is looking at your Twitter followers using something like the Affineo tool. Very clever data science, very clever computing power that's behind it, very clever way in which they've set this up right? But the fundamental principles you can apply to any data set, clustering algorithms, if you're experienced in coding, pretty simple to implement nowadays on basically any data set and incredibly powerful. So instead of saying, oh, we've got whatever it is, a few thousand followers of our BBC Earth brand on Twitter, we can suddenly start to say, wow, a bunch of them. A main interest in Twitter is news and information. So are we, are we providing news information or are we not? How much do we focus on it? A bunch of them are there because they want photography. So how much do we balance that type of content that we put out a bunch of them are there for sustainable environmental discussion, conversation and topics. How do we meet their needs? Also, what brands do we partner with commercially that would be interested in these consumers or that would help us to engage these consumers? Also, how are we growing our audience over time? Okay, brilliant that we've doubled it in the last six months. But like, which audience are we attracting? Which audience is not on the graph that we want to be on the graph? And how do we go get them? Amazingly powerful. Dead, dead simple. Obvious to us that the vast majority of data science, of data, of reports that go across most people's desks most days do not apply this simple lesson. Obvious, but not acted on. Incredibly, incredibly powerful. I mentioned earlier that somebody who could speak even more eloquently on this topic than I could if he could be with us today is this chap who completely fell in love with the clustering, the data science work we did in the music industry. One of the recommendations, there was a cluster of people, segment of people at the time called gadgeteers. They were always on their phones, on social media all the time, very digitally engaged. At the time, that was a segment of people. Of course, now that's most people. And one of the recommendations was that they were the next audience, statistically they were the next audience that he could grow his reach in. And he totally embraced it in the meeting, kept saying, interrupting the meeting, saying, we've got to get them gadgeteers. Got to get them gadgeteers. And sure enough, over the months and years that followed, he went after them gadgeteers. Look at how engaged he's been on social media. Perhaps too engaged. Okay, look at all the digital partnerships he did with technology companies or with social media networks. It's fantastic the way in which he embraced that insight, that simple conclusion that he could carry around in his head. So segmentation is a method of generating an insight without an insight, without that clear conclusion from all of that great data science work, there's no way he would have resonated with him and there's no way he would have acted on it. There's no way he would have grown his audience in that way. So obvious, simple, not usually acted on. Incredibly powerful when it is. So segmentation is number one. Number two, by way of lessons is to take, okay, admittedly, sometimes big data and to make sure that it is distilled down into the minimum amount that's needed to make a decision, which is usually from maybe billions of Data points, about 10 data points on a graph. Usually it's no more than about 10 things you're trying to get out of that billion data set, maybe three or four. And in this case, fantastic example of taking that principle to the extreme, delivering a super simple insight to the business when they really could have got bogged down like most data scientists do in delivering reams and reams of reports and graphs and data and totally losing their audience. So this company, Para analytics we use, they're in the entertainment space, particularly in the TV space. They take massive amounts of piracy data by the second, by city, by country, by day, all around the world, by TV show, by IP address. They gather all that massive amounts of data interconnected like a network. They gather social media data, interactions and engagement, Wikipedia page views and engagement, all the publicly available data they can huge data on TV consumption, swirl it all together into this data science soup. They do their magic, algorithmic magic, but they don't bog us down in that. They tell us for each TV show, how much demand are they seeing for it in each country by frankly for us in each country by year gives us a pretty good window into where the demand how do we go get it? Next we can say, okay, let's look quarterly. Now we can start to action it. Okay, now let's look monthly. Okay, now let's look daily. And we can pull some levers at a daily level. But you don't need to start at that level of complexity. Just tell me how much demand there is for Doctor who in Korea. Let me compare that against how much revenue there is against Doctor who in Korea. I can see that there's a massive disparity, therefore we're somehow not monetizing that demand. I can go do business things differently to try to better engage those consumers, to try to better monetize them. It's a dead simple inclusion from basically one data point out of billions of transactions. But again, it's usually lost in the reports, the complexity, the equations, the methodology. They give us one data point per show per year right now is all I want from them. And it's amazingly powerful. So focus on distilling down data science work, big data work to the absolute minimum you need. It's probably a very, very, very small amount of data. Next is to use the power of data science to not just report on things, but to proactively tease out insights, to predict things, if you will, or to sift through data sets and tell you where the insights are so that you don't need that people don't need to do it themselves. Market research, our traditional way of teasing our insights is to pour over a set of cross tabs. Big, big sets of cross tabs. They're still produced. Who has big tabs of pages of crosstabs like this? Yeah, thank you. Some people are being honest, some are not. I do, by the way. I do. It's still the primary way we use get insight out of our research. It's Excel based but if you printed it, it would be this big. Very, very common to have actual printed crosstabs by the way, still particularly in political polling. But anyway, no longer do people actually have to read crosstabs. It's totally possible for computers to read the crosstabs for you and tell you where you should start looking. I can't tell you what the answer is. You absolutely need to work the answer out yourself. But you don't need to pore over the crosstabs. Computers can proactively tease out for you where the particular differences are, particular pain points. One company that do this to great effect is civic science. So we use them at HarperCollins Book Publishing, combining a database of responses they already had and then within the 24 hour period asking them to go back and beef up the cross tabs as related to book publishing. They ask some quick book publishing type questions for us. In 2448 hours we're able to get analyze 72,000 consumer interviews to think about a partnership in book publishing between a publisher and in this case it was Samsung, the phone manufacturer. So this is a few years ago and if you go into their tool, it's so refreshing, you open it up and one column here is people who are Samsung fans on the research. They're like my next phone will be a Samsung, I think is what they said. And the other column are people who are Apple fans. This is a few years ago, right? Different now, but people who said my next phone will be an Apple phone. And you just pull those apart, put them in the columns and the tool tells you where to look. It draws your eyes to the key conclusions. So you always want to look at gender and age and maybe race, particularly in this country and an income level. So always make sure that they're at the top of the cross tab for you. You but it highlights in black or gray whether there's a difference that's statistically significant and if so your eyes are drawn to it. You can read down really quickly and easily and tell what the answer is without having to pour over cross tabs. And it gets much more interesting when you go beyond the basic questions. You scroll down Just a little bit more and it starts to talk about NFL teams that people are following or how often they exercise or where their personal finances are characterized by themselves as being in trouble or not. Stuff that you would never normally get to without paging through cross tabs. But it's perfectly possible for the computer to say, you know what, this is quite interesting, I'm going to bubble this to the top for you. It's a pretty simple algorithm that, again, these guys do brilliantly, but you could apply it to any data science work that you do pretty easily. So save yourselves loads of time and get the computer to sift through stuff and tease out insights for you is another lesson. All right, now we're going to move on to the kind of people side of it, the kind of organizational side of it. As I say, there's no point doing all this great work if it ain't going to get used. So again, back in the music industry, there was a project we did to put tons of our research data, quant research, good old fashioned quant research data to make it available online. We anonymized the artist, we anonymized the song that we'd played during the research. We anonymized some other stuff maybe we coded them, encoded them, and then we published it for a bunch of data scientists. And they spent 24 hours over the weekend all around the world, hundreds of data scientists competing with each other to use the data that we'd given them, where we told them whether somebody liked the song or not, to predict given another set of data, another set of people, another set of songs, whether they would like the song or not. And we already knew the answer, we just hidden it from them. So we took this bunch of training data of research, took out the result from the other set of data and told them, hey, see if you can work out what people would have said. And yeah, hundreds of data scientists all around the world competed against this, against each other. The team in China won the main prize. They were best able to predict whether someone would like a song or not using the research data. It was fantastic. So actually there's quite a lot of lessons here. I mean, one is there are massive numbers of data scientists who would love to help you solve your problems if only you could find them. And we used a company called Kaggle K A G G L E who run data science competitions. So if you can't hire data scientists or don't have data scientists and partnering with Kaggle, albeit on an anonymized basis, you can suddenly get Armies of data scientists to help you solve your problems. They taught us a few things. One thing they taught us was that demographics were pretty rubbish at telling you whether someone was going to like a song or not, which is something we already knew and something we've heard this week from our speakers. But it was fantastic to have hundreds of data scientists all independently draw this conclusion from looking at a data set. Didn't that boost our morale a little bit? The demographics are absolutely rubbish and other stuff was much more important and one team won. Anyway, that's not the lesson. The lesson is the reason you do data science and the role that your work plays in an organization is vitally important. This is how big mainstream British newspaper described our work. The perfect pop song. It's the algorithm, not the rhythm that counts. Predicting a number one song used to be a mugs game, obviously an English newspaper. But a team of data experts and computer geeks will generate a scientific model which promises to help EMI star act craft the perfect hit. It's absolutely not what I just told you we were doing, right? Absolutely not. Predicting who will like a song so that we can market it to the right audience, I think is a wonderful way to use data science. Hey, you've done a great song. I'm going to help you find an audience for that song. Big or small, round or square, I'm going to help you find the right audience. That's a great business use of data. This I think is probably not a great business use of data. And if I'd gone into the music industry saying, hey, I'm going to help you write better songs, I probably would have been swiftly ejected on my rear. So what is the role of data in an organization? What is an appropriate use of that data that supports and helps people, people to do their jobs versus what is a role of data that steps on the toes of the creative process a little bit and is not going to help you make friends and influence people? So what is the role of data? I think in the music industry it's pretty clear to me. I don't want to work for a record label or a book publisher or a TV company that uses data to write scripts, that uses data to produce songs. I want to work for a company that uses creative people to express themselves the best way possible, but then applies the best damn data science in the world to find the right audience for that creative work. That's me personally. Other record labels would disagree, by the way. So what is the role of it in music? As I say, the places I've worked and in TV and in book publishing. It's clear that that's the role and it's clear that that people make decisions. Which artists to sign, how to promote a song, which countries to prioritize. It's clear that people make decisions. Whereas many would have you believe actually it's the job of the algorithms to make the decisions. The newspaper would have you believe that. Data scientists would have you believe that because that's in their DNA. They generally work in pretty non, non controversial, non creative industries that generally mathematicians and scientists. Oh, if this is the optimal solution then of course that's the one that we should pick. Of course that's what they drive towards. But then they alienate people along the way, tread on toes, failing to respect the fact that actually people make decisions in businesses, in creative businesses. But I would argue in most businesses the job of the data scientists, the job of data and the job of research is to help those people make decisions. It's subtle but really fundamentally different way of going about your role. It's a fundamentally different impact you'll have depending how you position yourself. I've made this mistake many times in my career as well. One time in the record label we had a brand new artist that the team had just signed and they were super excited about it. Everyone in the building was talking about this new artist. It's we do that for every artist by the way, but this one in particular. No one had ever heard their music outside the record label before. They were completely unheard act and they'd recorded five songs. I built some trust and respect in the organization so they started to use me in some of the more creative processes and they said, hey David, this research thing you're doing, can you research these five songs and help us to pick what the lead single should be? This is the first song this band are going to use in their whole career. The song they'll be defined by forevermore. It's so important to get this right. So I'm really pleased I've been asked, right? So I go away, I do the research, good old fashioned quant research, bit of data science on top. I come back, I've got this big smile on my face. Because one song statistically outperformed all the others in several countries. It was a really clear winner. So I came back with this big smile on my face. I said I'm really pleased I can help you with this. Not always can data in the data science and research help. So it's important to recognize sometimes it can't. When it can. Hey, let's celebrate it. It was a clear winner. And the guy looked at me and smiled. I said, what's going on? He said, well, that's not the first single. Then I was about to get all angry. You've asked me to help. I've done all this bloody research. There's a clear winner. You're going to disrespect it. You're going to just do whatever the hell you want. What kind of business is this? No, luckily I didn't have chance. So then he says, they're not ready for a big hit. Oh, also, as the band hasn't gelled yet, they need time before they can sustain that big hit and maximize it. Also, they haven't got an audience, no one's ever heard of them. It'd be a lot better to start with some small songs, build an audience, and then when they have the hit, not only can they sustain it, but they've got a bass to spring off to, grow it into a proper hit. I suddenly realized it's the same lesson again, right? People make decisions and for good reason. Not sure it's any different for. Not sure it's materially different for, I don't know, cars or cakes or any other product. People make decisions. There's more to it than the data. There really is. There always is. And if you're a data scientist, intuition is to roll right in there and tell people the answer, tell them what they should do. But positioning it just slightly differently, saying, hey, I've got some data that can help you make the right decision. It's a really different outcome. You get to really different role you play in the organization and it's a really different path to success as well. So, yeah, a lesson I've learned many times. But people make decisions, not algorithms. Many, though, would have you believe that's not the case. Many people would disagree with me. Some, some of you might disagree with me. You're welcome to in the Q and A, major foreign policy publications, major marketing publications, major business schools. Doesn't matter who you are. A lot of thought leaders these days are arguing that computers will make decisions on our behalf, that humans are needed way less in decision making. So work and life in the age of automation, suggesting that work will be different, will do different things in marketing in 10 years time, algorithms will take complete control of the creative process and usurp advertising agencies. Well, I clearly don't think so, but some people do. And Harvard Business School, is there still a role for judgment in decision making? Is good old Fashioned intuition, out of date. These are bonkers, I think, but they're legitimate viewpoints. So here's why I think. Here's how I think differently about it. I said people make decisions. You've got a clue. There's. There's more to it than that, though. And the lesson comes from chess. This is the perfect lesson to work out what the role of data, data science, marketing, research, call it what you will, it's the perfect lesson to work out what role it plays in organizations. In 1997, I think it was Deep Blue beat Garry Kasparov proving once and for all, as you might think at the time, proving once and for all that computers can beat humans and it's just a matter of time. They'll solve every problem and will be irrelevant, as you heard yesterday. That's not the case. Actually. There's two lessons here. It's quite nuanced. The first lesson is that teams of humans plus machines could dominate even the strongest computers. Even the strongest computers. And that's something to do with human strategic guidance combined with the tactical acuity of a computer. And it was overwhelming. You know, this has been done many times since then. We know what the steady state looks like for now. Overwhelming. I really like that language. It's clean, crisp, powerful, and it applies to businesses. All right, so if you're a business saying, I'm going with gut instinct alone, I don't want any data in my life, I think you're in big trouble. But also if you're going. If you're a business saying, I'm going to algorithmically solve the world, I don't need all you decision makers anymore. A computer can do it for me. As many data scientists would have you believe, I think you're deeply doomed. And it's that partnership that you need. So this, I'm sure you can think of, businesses that are on both sides of that equation. There are some very clearly staked out their case, either on one side or the other. I think they're both doomed. Ultimately, it's that middle ground of working out how you do it is the key. That's really the second lesson, is that it's not good enough to have a really good computer. It's not good enough to use data and skills and judgment. It's how you do it that counts. So you have to partner well with data. So the lesson from chess is brilliant. A weak human, so like not a grandmaster, not very skilled chess player with a computer and a better process was superior to a strong computer alone. Right. We know that from the first lesson, but more remarkably, was superior to a strong human, a great chess player player and a computer where they hadn't quite worked out how to do it. So you don't need the best chess player in the world. In fact, the best chess player in the world, if he hasn't quite worked out how to use data, part of his game ain't going to cut it. A kind of good amateur chess player where he's got really good at using a computer. In fact, I think they use three or four simultaneously. But really good amateur chess player who's worked out what the role of data is in his game, where to use it, where not to use it, how to use it quickly. That is, what do they say? Overwhelming. I think that's the lesson for business, right? Who works in a business that has the best marketing people in the world? Put your hand up. Who works in a business that has the best sales and distribution people in the world? Yeah. Nobody, right? Because the best people always work for a competitor. Someone famous said that, not me, but it's true, right? None of us. We have some great people. We have some great people at BBC really do. People I'm so proud and privileged to work with every day as a whole. Do we have the best people in the world? No, we don't. No. Nor do you. We don't need them, though. If we can get really, really good at working out how to use data, when to use it, when not to use it, what graphs to look at, how to have them at our fingertips ready to go if we can get really, really good at it. That's the lesson. Remember I said you can have all the data in the world. The best computer would be the parallel here. You don't know how to use it, you're not very good at using it, you're in big trouble. So the lesson, I think is from chess and I think how that applies to business is I think data tools, Chess computers has a front end as a data tool and we need to present our data, whether it's data science or research data, frankly. But we're past that now, aren't we? We're saying we need data. It doesn't matter what data it is, we do it all together. We've agreed that the last couple of days, now we need to give it to people. This is the last step, right? And the companies have solved this problem in other areas. But it's funny because in business, many people tell me, still, yeah, I don't want to look at data. You look at Data, you tell me what the answer is. Anyone told you that? Don't give me the dashboard where I have to look at the research data. Your research. You look at the research data, you tell me what the answer is. Yeah, happens all the time. People don't want to look at research or big data or any data. People want an expert to kind of deal with that for them. Think about the chess example. Not a very good idea. But also, those people are using data tools every single day to make decisions in their personal lives nowadays. Not a few years ago, nowadays. Should I carry an umbrella with me today? Where should I invest my bonus? Do I need to walk to Starbucks or can I send my assistant? Do I need some more steps today? They're making decisions every day using data. But data tools that, again, help people to make decisions by visualizing it beautifully, putting just the right data there in just the right format. Data tools that help people make decisions but don't tell them what decision to make. Again, it's the problem researchers make, isn't it, that we tell people what decisions to make? Data scientists certainly do. They don't make that mistake. So we need to build data tools that put data in people's hands when they need it and in a way that they can access and make decisions on really easily. One example of a company that I'm really excited about in this space, there aren't many, by the way, but one of them is called Riser. It's data visualization. Right. Which so many people do. You're drawing more graphs. Loads of companies can take big data and draw lots of graphs from it. That's brilliant. There's a lot more to it than that, though. And this is why I'm really excited about Riser. So not just we're loading all of our survey data in there. Every study we do, raw data person level gets loaded in. Yep, that's been done before as well. And you can draw cool grass from it. Great. But what's baked into this, I think the killer feature is not only can you go through, create all the graphs you need to tell a story. So, for example, for Doctor who, one of our big TV shows, you could say, here's a graph showing me who the audience is. Here's a graph drilling into the younger audience and showing you where they shop. Here's a graph drilling into the younger audience, where they shop and what they buy. Let's step back. Here's a graph showing what other cable networks they view. Here's a graph shot. You get the idea. You could Tell a story, create all those graphs, save them all down as individual slides, reorder them and edit them. And then when I'm done with that, not only will it update automatically when fresh data comes in, but I can send it to you. You can say, yeah, I don't care about Doctor who. I'm working on Top Gear. You can change Doctor who for Top Gear and rerun it, and you can edit and delete some slides and you can send it over here. And they can say, well, I don't care about the us I'm in Germany and I want to look at the German data. Flip a switch German data. So you can let people play with data and access data in a beautifully visualized way, but at the same time, it's crafted for them. So there's guide rails around what they can and can't do with it. They can't mess it up, but also they can be flexible and do the things they want to do. And you can obviously give different staff different levels of permission. So. So I might give you no permission whatsoever. Just take it as it is. I might give you full access to edit and I can see who's using it. So how many people are using this data set? Well, if nobody's using the Doctor who research, the great Doctor who research we're doing, then why am I doing it? I need to go out and chase people. Or if three quarters of the globe is using it, but Korea and Australia are stubborn, holds out some not using that data. I need to go have a word of their sales team because they're missing a trick. They should be using the data. So it's guided play is how I think of it. Play, but with guide rails and it's monitoring and access and sharing and all those things as well. Really simple stuff, right? Really, really simple stuff. But as Dan Ariely's talk told us earlier, the devil's in the detail. Getting these details right really, really matters. So it's not just, oh, yeah, another data visualization tool. It's all the various things that you need that go with it. You can do nice, pretty pictures on the graphs, but automated and by default if you want. And you can do great geocoding and mapping in the tool as well, if you want. I prefer graphs, but some people like pictures. Visualization, whether it's the weather app or the steps app or the dashboard I just showed you, is really tough. This is a big data conversation as well, because if you don't visualize it in the right way, you may as well not have the data, you may as well not have done the work. This is a graph from a design studio that we use at the BBC and I really, really love it. Here's four things that need to come together for a successful data visualization. And you need data, story, function and form. If they all come together, boom, you've got the magic. The great thing about this chart though, is just go one step away, just get one thing wrong, read what it says in the box and it will explain why you've messed something up. It'll explain why something you did didn't quite work. So get everything right, but miss off the. Get slightly the wrong data and you end up with a detailed skill. And I can think of examples where we did great work, great analysis. It was a really cool graph that really spoke to the business problem. But you know what, maybe we'd used like the wrong country or the wrong year or the wrong, like base sample size or, you know, the cut of the data. You got everything right apart from one. And you know what? It didn't lead to a business decision. We've got one thing wrong. If you get the story wrong, it's hard to read this way around. If you get the story wrong but you get everything else right, then you end up with a boring graph. Right? Yeah, there you go. Boring graph. Oh, yeah, I can think of examples of that. It had great data, it served a great function and it was beautifully presented. But you know what, it had no story to it whatsoever. And people just glossed over it, their eyes glazed over and we skipped to the next slide. It really explains why you didn't have impact all those other times. And it really explains how, again, think about it. The devil's in the detail, how you have to get the details right if it's to succeed. So to wrap up then, I mean, if there's one lesson in all of this, it's about people. It's about people making decisions. Not all this fancy data, not all these fancy data scientists and not us market research people. Our job is to help them make decisions. So think about all the lessons along the way that help you to help them make decisions. Cluster data, or at minimum, tease insights out they can carry around in their head so they're prepared when the decision needs to get made instead of having to look it up. Give data at their fingertips, but let them play, but in a guided way. Visualize it in the right way, get all the rules right, distill data down to the minimum they need to make the decision, don't give them reams of paper, reams of graphs, reams of analysis. If they don't need daily data, just give them one data point per year. Help them by minimizing and distilling. But the lesson is, it's tough. There's all these things. But when you do get them all right, when they all come together, then even in very creative businesses, some of the businesses I've worked in in the past, very resistant to using data, resistant to using data to make decisions. But even those people, when it all comes together, end up making faster, smarter, more global, bolder decisions as a result. So it's a battle worth fighting. Thanks very.
More from David

How Can ChatGPT & AI Help You Make Your Business Better? - Guest: Marketing Strategist, David Boyle
youBEAT Cafè - Prompt for Artists / AI Revolution / ChatGPT with David Boyle (Audience Strategies)
Now that's Significant - Ep 52 - Reimagining the Future of Marketing with AI - David Boyle