How Chroma Color is Moving Beyond Lagging Indicators | Glenn Munshaw
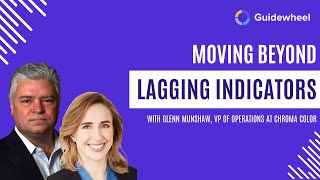
Webinar transcript (presenters Lauren Dunford of Guidewheel and Glenn Munshaw, VP of Operations at Chroma Color) about shifting manufacturing measurement from lagging to leading indicators. Glenn recounts challenges of paper-based/lagging OEE data, the crawl→walk→run rollout of real‑time power/CT sensing and Guidewheel deployment across multiple plants, and practical impacts for uptime, maintenance, ESG targets, and team adoption. The session includes implementation lessons (fail fast, build trust, calibrate signals), examples of unexpected uses (dust-collector compliance, predictive PM run-hour meters), and audience Q&A on adoption and prioritization.
Chapters
Hello and welcome to this webinar. How to move beyond lagging indicators to improve your bottom line. This flexible packaging event is brought to you by Guide Wheel. I'm your moderator Derek Thiel and thank you for joining us. Our presenters today are Lauren Dunford and Glenn Munshaw. Lauren is the CEO of Guidewheel, a global software company on a mission to empower all the world's factories to reach sustainable peak performance with Plug and Play cloud powered factory ops. In addition to a Bachelor's degree and an MBA from Stanford University, Lauren brings with her a dozen years of experience in supply chain and operations. She and her team are currently working with over 90 manufacturers across 7 countries to reduce lost production time, increase throughput, and perform better and better over time. Glenn Munshaw is the Vice President of Operations for Chromacolor Corporation. With six manufacturing locations. Chroma is a leading Color Master Batch Producer in North America. Over A career of 35 years, Glenn has held manufacturing and Operations excellence leadership positions with other basic material processing businesses including GE Plastics, Johns, Mandville, Envista, Americhem and rtp. Glenn earned his BS in Industrial Engineering Operations Research from University of Massachusetts and he is a certified Six Sigma Master Black Belt. Don't forget to submit your questions and later in the program our presenters will address as many as possible. Today's event is being recorded and archived on www.flexpakmag.com and now I'm excited to turn it over to our presenters, Lauren and Glenn.
Terrific. Thanks, Derek. And today I'm just so excited for what will hopefully be a fun and very informal Q and A with Glenn, who is incredibly thoughtful in this area of how to move beyond lagging indicators and use leading indicators to very thoughtfully manage the bottom line. We'll start by learning a little bit about what that world of lagging indicators can look like from his experience, then hear from him about what that journey has been like, things he's learned along the way, advice for others, kind of wisdom from very practical experience, as well as kind of high level knowledge that'll include both the very obvious world of things like overall equipment effectiveness and some interesting and surprising insights that Glenn has had in other areas as well. So stay tuned for those. But I don't want to delay a second more before getting to Glenn. Maybe let's start by diving in on that specific topic of what that problem can feel like when you're managing with lagging indicators. What was that like for you?
Yeah, absolutely. And good afternoon to Lauren and everyone on the phone today. You know Just a couple of principles up front. You know, things that I've learned. You know, you. You really need to. If you don't measure, you can't improve and you certainly can sustain. So having good measurements that can drive action and behavior are absolutely critical. Critical. And also having measurements that are balanced across the business, the customer experience, the.
Experience, productivity, and I would call the operational excellence metrics. Traditionally, we had access to things that happened into the past, hence lagging indicators. We had the injuries that had occurred, we had the pounds that were produced, the scrap that was produced, the hours that were worked, the overtime that was spent. All of those generally were rolled up at the end of the month or sometimes at some point over 35 years, probably at the quarterly level. And we dove into that data to understand what it was telling us and could we understand causes and areas of interest to.
Deeper into. And inevitably you would find some nuggets of opportunity. But because it was all in the past, it was too late to do anything about it. You've lost ground. Also, it was very difficult to be able to dig out really what was happening contemporaneously when the data was driven. And I'd say the other thing was, because it was so results orientated, there was probably an uncomfort level of uncomfortness with the operations leaders because it felt like they were under the microscope already from a P and L standpoint. And here were a handful of other lagging indicators that they couldn't do much about in the past. So, you know, it didn't, it wasn't optimal, but it's what we had at the time.
Yeah, completely. And this is the world many folks that we speak with are living in today. Any stories that come to mind of what that felt like for you personally, for the team, or any kind of things you remember about what that meant for the business?
Well, you know, the thing that's most painful is the hours, you know, in front of multiple spreadsheets trying to cut and paste data, you know, into something that you could establish some correlations between variables, which, you know, ultimately was what it boiled down to because no single thing was kind of that golden nugget. So just a lot of pain in terms of being able to pull data into something that was usable not just for the analysts or the manager or the leader, but also, you know, the people on the floor having to, you know, record information on paper, let that find its way up through the information flow and be eventually hammered into a spreadsheet or a database, you know, that, you know, certainly wasn't value add in terms of the application of our indirect and our direct resource hours, but it's again, what we had. And part of it was limited to the equipment. You know, a lot of these companies, some of the companies that Derek mentioned that I'd worked for in the past and my current company, you know, it's not all brand new equipment that is, you know, outfitted with PLC SCADA together to allow us to easily pull information from the floor. A lot of it is legacy equipment that has a lot of life left in it, but will never, you know, be able to justify PLC upgrades for some of that equipment. So we didn't have any other way to get at it anyway. And those are probably some of the painful memories I can remember. Lauren.
Terrific. Well, we'll start getting out of the pain then. What were some of the solutions that you explored? Anything you tested that didn't work? How did you end up finding a solution?
Yeah, so, you know, interestingly, you know, we started, you know, with a paper based system or, you know, a couple of different companies that I've been with, you know, trying to mimic what you've done with guide wheel in a very manual way. You know, essentially paper and red and green pens and breaking, breaking the day up into 15 minute increments and having operators line side coloring in squares red or green and assigning causes to those squares if the line was down. And hopefully you were also getting maybe the rate or the speed of the line and that would be captured as well. And then we were able to aggregate that into a database again, usually lagging up to three, four weeks in the past, but more along the lines of representation and in a traditional OEE sense where we could look at percent of rate, standard percent of, you know, availability or uptime. And more difficult I found is, you know, incorporating yield into, you know, some of those manual systems because the yield is typically sitting in another disparate system that was, that was difficult to, to bring in. So that, that, that, that was probably the most successful, you know, approach that we came up with. Certainly not, not optimal. And you know, I think you and I talked a long time ago about, you know, we had done an experiment at one of my, my companies where we'd actually use the current transformer to, you know, try to see if we could measure, you know, you know, the, the power on a particular piece of equipment that we viewed to be as a proxy for whether the line was running. And while we could, you know, get the data from the, from the current transformer, we Just didn't have the front end to manage that data, to filter and manage the signal in a way that was usable. So both of those approaches were attempts to more automate and streamline our collection of valuable OEE data.
Amazing. And a lot of the folks that we work with, yourself included, talk about this journey of crawl, walk, run, starting with the highest impact areas and then layering on for the team over time, maybe to dive in a little bit. What has that journey looked like for you and the team?
Sure. You know, I remember looking for solutions to our OEE data collection process and you know, it started with a web search and you know, the name of your company at the time was Sophie. And you know, you since rebranded, you know, given the direction you're going into guidewell. And you know, we started an early discussion probably a year and a half ago. I'd say at this point, maybe, maybe even a little bit longer. And you know, what I was looking for was an out of the box solution that was supported that would allow us to quickly get data coming in real time that we could start using to begin developing some of the leading indicators and also having more real time data that would drive behaviors in the moment to get us a more, more pinpointed result. And you know, the walk, the call, walk, run analogy is spot on because as we went through the initial phases and we started with two plants really out of the six that we focused on. And it was, you know, within three weeks, you know, of the discussion that you and I had at the time, you know, we had current transformers clipped on to legs of main motors on, on extrusion lines at these plants and hubs were installed and we started to get signals, you know, coming in. We could see kilowatts, you know, coming in. And you know, day one is, okay, so what is this telling us? You know, there's a live signal out there, you know, what does it tell us? Well, almost instantly it told us what was up and what was down. You know, real time, you know, the, you know, the filtering of the calibration of the power that distinguishes between running idle and down. That takes a little bit of tuning, not too much, it's pretty straightforward. But saw what was running, what was not running. And then we started to see the trends in the data that we were receiving as well. Some fascinating insights, how we'd be running the same product for an entire shift and the power that we were drawing would change. It sometimes would be constant and steady, but sometimes it would start to decay, it would start to drop off and it was interesting almost immediately, you know, we found some instances and this won't be a surprise to my manufacturing peers, you've probably seen this as well. But you know, it wasn't unheard of, of operators to slow machines down a little bit. So the changeover hit on the next ship and we, we could see that happen in, in a number of cases. You know, the other thing that we saw in the, in the crawl phase immediately before we started really understanding targets or anything like that was, you know, when machines were starting up on a shift and when they were starting shutting down, you know, if we're working a 10 hour shift or an 8 hour shift, you know, how, how long into the shift, you know, are we producing? And you know, everybody, you know, would say, oh, we're up in 20 minutes from the time we hit the door in the morning and producing. But in reality what we found was there was a lot more to that story than we were kind of led to believe. And we could see these periods where we just weren't hitting the ground running as quickly as we thought we were. So that was an immediate area for attention for our site leaders to be able to tighten up the discipline of getting started and being ready, the preparation that goes into a shift, the, the 5s things and you know, the moving, moving stuff that's in downtime to external time to be able to minimize that internal downtime. And then on the back end, the same thing when people started to shut down the head for the showers, you know, we started to get some, some visibility to that. So that was the, that was the crawl phase. And you know, in that we saw enough opportunity that, you know, I made the bet to take it across the entire fleet so that we outfitted all of our plants with this technology on our main production lines and begin to build up our dashboard of the performance.
Of our lines. So that was the crawl phase. I'll just pause for a second. Lauren, if you had anything you wanted to zero in on there in particular before I move on to the walk phase.
Yeah, this is channeling a question we often get, which is data for data sake. The best insights don't mean much until they're translated thoughtfully to the human side. Any advice from what you've learned either through that experience or through other experiences of how to take those insights around startup or shutdown or kind of seeing those machine patterns on the shift and help them translate into results and team engagement?
Yeah, I think the key there is building a level of comfort with the users of the data Starting with the site leaders down into the maintenance organizations and the shift supervisors, first of all, that they understand the data, they understand where it's coming from, how it's being calculated, and that they can trust it. And then once that trust is built, then there's more receptiveness to action on the data. It's pretty cut and dry. Hey, this line didn't start up. This rate did go down. We can now talk about it either at the time it's happening or within 24 hours of it happening versus maybe it being a month ago. And nobody could, could really, could really remember then the kind of, the next step, the transition from the crawl to the, to the walk was, you know, okay, now taking larger periods of time and really analyzing it to see what the baseline was. Right? Because, you know, one of the, one of the areas of pushback, or I wouldn't call it pushback, but just concern about being measured against something was, hey, you got to understand, we run a lot of different products. They run at different rates. Some are easy to go from one product to another.
It's like, okay, I understand that, but we're going to look at longer periods of time to get a baseline. And we're almost going to use statistics to say, hey, this is the average. This is the standard deviation during the baseline period. Now we're really interested in, you know, significant causes or deviations that are outside the normal distribution. Right. We're looking for changes in mean, changes in variation that are greater than, you know, one and a half or two sigma from, from the average. Right. We didn't, we didn't use those tools. But for anyone who's a six sigma person, they would recognize, you know, that definition from a, from a control chart. So it's kind of using it now to set, you know, limits to alert supervisors and plant managers when we've had enough of a change that you need to worry about it. Okay. So that then, you know, reduced the amount of noise of, you know, too many signals coming at us in terms of things going up, going down, rates going up, going down to things at least from a baseline period that appear to be statistically significant. And that allowed us to work on really the next level of improvements and also set some, set some targets, right? So, you know, we, we this year in particular, we had enough data that we were able to, you know, set some availability, some rate and some yield targets really by line. Well, by plant and by line in a number of cases that were tied to this data. So kind of breaking apart pounds produce into what's that a function of? Right, it's a function of the three things that I just, I just mentioned predominantly. Right. So now we had, you know, lower level KPIs or metrics that were more leading and allowed the people that could impact or make a difference to, to take action more immediately with those, with those areas, whether it be rate or, or, or uptime in particular. And you know, we, you know, we're in a year and a half of this now. We've now been able to deploy some of those lower level OEE metrics into individual smart goals. So I have a set of very high level business goals around providing a safe workplace driving, productivity, customer experience, financials. But I need to blow that down, have that line of sight that cascading down to the kinds of data that comes out of, out of guide wheel and that's allowed us to set.
Appropriate goals for improvements in each of those areas. And that's really, now our focus is to, okay, let's use the data, let's use some of the tagging that goes on every shift for the causes of downtime, build the Pareto and begin working on projects to identify how to, how to make improvements there. We've justified capital improvements using the data where we could see the power consumption, the pounds, the uptime. So we know rate, true rate, and if we have a way to increase rate from X to Y, we can create a financial pro forma that shows that we can secure the investment, have secured the investment in a number of cases and then we can go back and audit and show can we see that shift in rate very easily. And what that does is it builds credibility for the team in terms of their ability to deliver on what they feel they can drive as improvements in the business. So that whole transformation from just getting the raw data, some basic aha's and things that we want to look at, then quickly move to metrics.
Getting comfortable with the metrics, developing trust that hey, I'm not going to beat you over the head over a particular data point. You know, very sensitive to not calling up a plant manager and saying, hey, why is this lying down? I don't do that. I might see it and I look for larger trends and I try to use it holistically in our discussions when we review our monthly operations KPIs as well. So I don't know if that kind of got at the question that you originally posed. Lauren.
Definitely so helpful and I love also the way you are so thoughtful about what you don't do, what it Is that could cause a different perception or more pushback. So one of them being, you know, you don't call a plant manager if you see a line down. We'd love to learn any other things that you would recommend or that in your experience.
One should resist doing or not doing. And then I'll ask about some things that you do do.
Well. You know, I do want to revisit the. Establishing the trust. I think almost universally, we all can do a better job at understanding unintended consequences and management of change. Right. And you just can't underwhelm what it is, what it's not, and how it's going to be used and, you know, trying to get, you know, more people involved, you know, sooner or faster. I know everybody's busy, but, you know, if it's coming from the top, you can generally set some priorities around that and help people make time to make this important. I think that would have moved our implementation along faster because over six plants.
You know, there's really six personalities out there. The way I think of them right there, six different cultures. Even though we're the same company, you know, we have the fundamentally the same culture, the chroma culture. But, you know, every plant leader, every. Every site kind of brings their own twist to it. And, you know, not all plants progress at the same rate. And what happens as you start to see, you know, plants, you know, kind of getting ahead, you know, there's. There's a tendency for people to say, I'm seeing more in this now. And, you know, you know, the plants that maybe were slower to adopt begin to pick it up. So, you know, I guess I expected everyone just to love it, embrace it from day one. Right. And, you know, I guess I didn't appreciate, hey, I've got some concerns here. And, you know, I need to understand how we're going to use this data. And it just takes time and also understand that not all plants and all site leaders, not saying they're bad site leaders. There's, you know, they have different points of view and different experiences that they bring with them. They progress at a different rate. So over time, you narrow is what I find. So that's the good news. As. As this becomes more transparent to the, to the entire team. Okay, so, you know, I was going to move on to the running phase at this point, unless you wanted to go somewhere else with another question in the meantime.
Running phase sounds great. And then maybe after that I'll ask, what are you glad you did? You know, kind of those learnings about what you would do again as well. But running phase sounds fantastic.
Yeah. So, you know, and I don't want to project that we're out of the walking phase, because I don't. And there's a portion of it I think you're always in. And the data becomes more and more embedded in the daily culture. I think you use maybe on your website a quote I said once about, you know, I see guide wheel and this kind of data being as important to the site leader as their, as their email. Right. It's the heartbeat of their plant. And, you know, we're not there yet. We've, we've made inroads. But you know, every day, every week, every month, we're moving down that path and we're getting more and more and more people engaged in this whole journey. And I think as we get to the future state of individual operator iPads, where they have a very simple way of seeing into the schedule and how their lines are running, that will really be.
The interlocking piece that we have, the person running the machine not only while we're collecting the current transformer data automatically, but they're providing more easily, some narrative, the lot number, the product that we're running, where they thought the line started, and shut down, more meaningful data. Because then we can now get to performance by operator, not just punish anyone who's at the top, but more importantly, what can we learn from someone who's operating at a higher level that we can translate, train and develop so that we don't have an operator, a bunch of operators here and a bunch of operators here. What I want to do is take this top group with the knowledge that are generated and bring the other group up so that everybody's operating at the same level. So the variation in the plants by line and the experience that customers get by line or by plant goes down. So that's kind of the end game. And you and I and your team have been talking about that quite a bit and we're excited for the future there. But some of the running things that we've been able to do.
We handle a lot of powders, combustible dust as defined by OSHA actually in nfpa. And we have air permits that we have to comply with. And some of those air permits require us to be running our dust collectors and our fume collectors when we're operating. And if not, we have to shut down. So just some kind of out of the box things that we're using the guide wheel technology to do is, you know, we're we're putting, we're putting the technology on our dust collector motors so that we can see, you know, when they start up and when they shut down. And if they, you know, go down during the middle of a shift, you know, it's a trigger. Now that, and there's an alert and maintenance has to respond and the site leader or the shift supervisor has to, you know, follow their procedures about a shutdown. And, you know, we can document that in our, our computer maintenance management system today. There's kind of a manual step right now, but we can close the loop between what we're expected to do in our operating permits to data that again, you know, provides a high level of confidence to an outside agency that's coming through. But also for me, I can wake up in the morning and know if my plants are in compliance or not. And that's, that's really important to us. We, we're a compliant company and we're going to strive for compliance all the time. So that's, that's been a nice, you know, kind of thing. We weren't thinking about using it for. You know, the other area that, you know, we're starting to run on is for some of our key motors, for instance, dust collector motors, while we keep spares online or have spares that we can swap out, we prefer not to get into a position where we have a breakdown. And you know, while we do other technologies like ultrasound for bearings and we do vibration on these key motors, you know, there's other faults that, you know, can go undetected or could be aided by knowing the, the power quality or the, you know, the imbalances that might be happening across three phases of these, these motors. And the guide wheel technology is allowing us to clamp, you know, CTs on all three legs of key motors. And you know, we can alert to when the range of those three items gets above a threshold and you know, we can proactively get ready to resolve that, that issue maybe on a weekend. And you know, no, no interruption to production. So that's, that's pretty exciting to us. And you know, we're also working with your team on connecting that data automatically to our computer maintenance management system. So we know that there's no operator error that we don't document, you know, that we had an outage and we did what we did to resolve it. And then of course, we can use that data, what caused it and continue the continuous improvement. Circle. Right. That's the, that's the whole idea. But trying to make that data Easy to use and you know, the productivity that's going to drive, you know, through reducing unplanned outages. You only have to have one or two of them across six plants in a year. And that's pretty, a pretty expensive endeavor. And we all know the tightnesses of supply chain. Any, any unplanned downtime generally results in a disappointed customer. And that's, that's what we don't want to have. And we're, we're taking these steps to try to, try to avoid that. And I'll just mention one more. I know we're going to talk a little bit about ESG here in a little bit, but, you know, we're, we're also looking at our maintenance practices and a lot of our PMs are tied to time, you know, so we will pm a DC motor every 500 hours. We'll want to measure, you know, the barrel on an extruder every, you know, thousand, two thousand hours. We'll want to do a PM on a compressor every, you know, 500 hours, 600 hours. Today. It's all just time based, based on the calendar. And a lot of times we were finding that we're probably doing unnecessary maintenance because we either haven't reached the, the allotted time, it's just because it came up on the calendar, it has. We have no insight into how long the asset has actually run or maybe the conditions aren't even warning that has to be taken down, that maybe the PM just needs to be studying some of the, the telemetry that we're gathering through some of the other technologies I mentioned, but also, also the, the guide wheel technology. So we're, we're looking at using your application to be a virtual run hour meters. So, you know, if we put a CT on a, on a motor and we, we create a totalizer, essentially we can see what the, you know, cumulative hours run is in addition to the power consumed on any asset. And with our ERP and an API connection and believe me, I'm not an IT guy, I've just learned API through a lot smarter people than me that we can send that out to, we can send that data out of your system into our computer maintenance management system and we can use that to trigger the PM that, hey, we're approaching 500 hours or 1000 hours, now's the time to get ready for the PM. The maintenance manager goes to the production meeting once a week and says, hey, I need dust collector 1 or extruder 12 next week sometime when you think you can do it. Hey, we've got a changeover coming up. It's going to be a big one. You can get in there and do the work when we're already down. Right? That's the utopia, right? It all comes together with real data that people believe, different functions coming together and increasing efficiency.
Amazing. And I just love also the innovation that you and your team have brought to different ways using Guidewell that we wouldn't necessarily have expected. You did tease the ESG1, so maybe I'll just ask, how are you thinking about ESG as it relates to the overall business, to your specific role in VP Ops and yeah, how are you thinking about that? Space.
Yeah. So environmental governance and sustainability. Governance is a pretty broad topic, right. And it's something that Chroma has recently posted Our Policy and our Plan on our Internet if anyone's interested in seeing that. Again, lots of different avenues to it. You know, there's also, you know, we've also been looking at and are now certified to an Eco Beta standard, the bronze level at this point. But we continue to work that and expect to grow that in the future. For operationally, for me it's boiled down to really three things. Primarily it's, it's the, it's sustainable and you know, sustainable energy. And you know, can we reduce the amount of energy we're using per pound of production and can we reduce the amount of energy that is not renewable per pound of production? So those can be different, different things and can drive different solutions. But you know, as we get into it, you know, we set goals on electricity usage of 3% a year. You know, it's on a per pound basis. You know, we need to be driving that to achieve a 30% reduction by 30, 30 we have a water reduction usage target about 2% a year for about 25% reduction by 3030 and 25% reduction in solid waste going out of the plants per pound produced by 2030. So you know, the first, you know, couple of years, not so hard, right? You know, as we get more efficient in the operation, we kind of just pick up that, that benefit already. But once you get through the low hanging fruit, right, you move from, you know, 1sigma to 2sigma. Going from 2sigma to 3sigma gets a little bit tougher again for people that are six sigma inclined and that's going to require more precise data. So, you know, really understanding the energy consumption, how we're.
Consuming energy on individual users is going to be absolutely critical. And you know, we will be tapping into Guide Wheel to help Map, you know, where we need to focus, you know, more energy. What, you know, where, where do we have pumps and blowers that maybe are not operating on the right part of the, of the, of the power curve? And you know, is it a design issue, is it a setup issue, is a maintenance issue. We're going to need, you know, the kinds of information that's already flowing into us and guide wheel to go to that next level of fine tuning. And then, you know, at some point, you know, you know, water, you know, we need to measure water better and we need to measure solid waste. So who knows where you're, you're going to take, you know, the suite of tools. I suppose I'm not, I'm not, I'm not sharing anything you've told me. I'm just throwing it out that, hey, you know, these are the things that are on my mind. I'm sure they're on other people's minds. And you know, having everything available in One stop shop is always a, is always a nice plus, you know, for an organization. So, yeah, we're going to have to have a precise real time measurement system to enable our ESG objectives, you know, especially as we get out past the easy stuff. And I'm excited to have that tool available to make that happen.
Completely. Well, maybe I'll ask a question. Looking back on the broader journey. So crawl, walk, run, looking back, what are a couple of things that you're glad you did or that you would, you know, do if you were doing it again or give advice to someone considering a journey like that to do?
Yeah, I think what I'm glad we did was we moved fast. You know, we didn't over pilot this thing.
And I wasn't concerned about overpiling it, piloting because of the structure that you have in terms of there's not a lot of investment, there's not a lot of things we have to do. We install in a day and you know, and if we decide to walk away, you know, we can pack everything up and send it back, right? Yeah, we can fit. We could have failed fast if we needed to. So I think, you know, for me, I'm glad we didn't overpilot it. It's like, let's go at this fast and let's go at this in a big way and start getting some benefit. Because again, the cost versus the value was obvious to me from past experience as well as just, you know, I could see it. And, you know, being able to fail fast and relatively inexpensively really took the Tail risk away. Right. There wasn't a whole lot of risk. So I think you can move fast with this technology.
I think, you know, I probably would have got it more involved earlier. You know, not that it requires really it from the, from the owner's side because it's pretty self, self sufficient. You know, your maintenance organizations can go in and hook it up and you know, you literally don't have to go through a firewall because you're not on information systems. Although we do. I think the integration of the data, you know, and being prepared to integrate it with like ERPs as we're talking about now, Lauren, and doing API uploads of production data and scrap data to get the yield element, that's probably something I would have teed up sooner to get that going because it's really a separate group of people and probably wouldn't have slowed down the entire journey. So that's something that I might advise.
Super helpful. And because the topic today is not just about moving from lagging to leading and distribution indicators but also about kind of the impact to the bottom line. Not asking any specific numbers, just curious, how do you, how do things compare from where you started with lagging indicators to where you are today and then to where you think you can get in the future? Anything that you can share around the impact to the bottom line or to the business in that sense?
Yeah, well, it's been positive, I can say that. And moves of whether you're looking at availability or pounds produced per hour work.
Energy consumption.
In the order of 3 to 5 points pretty quickly is not unrealistic and you can move that pretty quickly just by you know, having a measurement that's one source of the truth. And you know, everyone's kind of following that, that, that North Star and you know, you can start to move things. So you know, like I said, five points of improvement at least is probably doable for anybody. And you know, it certainly was our experience that that was, that was possible and of course creating free capacity, which is the way I look at it, if, if a line is up and running and versus down I'm not paying people anymore. I don't have any more overhead. I'm, you know, I'm using more materials but that's you know, straight pass through in which there's margin on and you know, you get the volume leverage or efficiency of your utilities. So you know those, those availability hours or minutes are free capacity essentially and you know that reduces directly your cost per pound, certainly your usage of hours worked and kilowatts used. It's a little difficult right now with so much inflation on wages and.
Utilities to know exactly the portion of inflation and productivity. But on the usage, the engineering units, the leading indicators.
Definitely seen productivity.
Amazing. One additional reflection on that journey is around prioritization. We're all constantly in environments where time and resources and labor are very constrained. How did you think around where to focus first? Where to, like you mentioned, potentially parallel track if you were to do it again of, you know, this is a different team and different set of people. Any reflections on that area of prioritization of time and resources that you think might be helpful to others?
Again, the deployment is so straightforward. It's not time consuming that way. It doesn't compete with a lot of resources. I think where the competition for resources comes right now where we are in our journey is as we have this data right now, we can see how much is due to, how much downtime is due to unplanned maintenance, how much downtime is due to changeover downtime, how much is due to not having raw materials ready to go at the line.
Now we're deploying and need to continue to deploy resources to work on continuous improvement events around those areas. This is where the lean success sigma true roll up your sleeves projects comes from, because you've got people focused on a Pareto that you believe in and you can calculate the benefit of making the call to deploy those people. And for a lean practitioner, it's wonderful because you've got a story there that you can start with and you can quickly see the benefit. So that's really helpful that way. And I think, you know, where we're at now, and I think, you know, probably most people on this call today are feeling the same thing. We've come through two and a half, three years of the tougherest environment we've ever seen, you know, even tougher than the downturn of, you know, 2008, 2009. It kind of makes that one look like a speed bump in comparison.
You know, and we're starting to feel the economy contract, right? We're starting to see orders, you know, tighten up. You know, people had, you know, ordered strong to make sure that, you know, they, they could get their material. Didn't want to get caught without raw materials, you know, making sure that the shelves were full. You know, there was a lot of hyper demand in 2021 and even into the beginning part of this year. But for a lot of reasons, I think we're, we're seeing things, you know, settle out you know, maybe more in line with where we would be today if 2020 and 2021 didn't happen. Kind of the, you know, the natural growth curve from 2019, we might be kind of settling into a little bit of that. So that means that, you know, making everything you can, no matter how you make it to get it out the door to your customer is not as much of the name of the game now. It's, hey, we got to work the other side of the equation. The cost per pound or the cost per pallet or the cost per gallon or whatever you measure it, you know, that that's more and more important going forward as things tighten up. So, you know, again, back to where I started. You can't improve what you don't measure. And you can't, you can't improve to the next level. Detailed improvement levels with, you know, a yardstick that's in one foot increments. You need something that's in quarter inches and an eighth of an inch and 16th of an inch, you know, as you get better and better and that's where we're at. And I think the economy and business right now is kind of forcing us to. We're going to have to really sharpen our pencils here as we go through the next set of challenges.
Amazing. Well, last question will just be. In your job, you are juggling all sorts of different things. Every member of your team is as well. What has it been like for you and the team to partner with Guidewheel specifically on that journey? What we're always aiming to do is make sure you have, you know, an additional set of resources to lean on there. But curious if you have thoughts there.
Yeah, no, thanks for asking that because I think it's been one of the pleasant surprises of the whole relationship with Guide Wheel. From day one, there's almost been almost like a concierge type relationship. You know, got to know, you know, two or three people in your organization very, very intimately. You know, we talked regularly. If I had any questions, they were always quick to respond. Did a great job of, you know, scheduling a check in with me and some of my team members every two or three weeks to, you know, ask things how, ask us how things were going, show us things about how to use the system that we weren't really sure about, share ideas, what we'd like to see, you know, differently. And it was amazing how quickly some of those things came back into future releases of the product, which was fantastic here recently, we just had a four hour call with your team and Three people on your team were on it and they were fantastic. They had done a lot of preparation and had prepared an analysis of all our data even at a level in a cut that, that we hadn't done. And it gave us some insights and it drove us to some next things that we want to focus on, some deep dialogue on other needs that we see in the platform and sharing with us some of the things that are yet to come, like the operator portal and that type of technology. So the, the, the amount of support and extension of my team to you has been fantastic. Right. I kind of think of that you're like an extension to my team. Your team knows my name, you know, all my plant managers names, you know, all my, all my, you know, maintenance managers names. You know, that's a lot of people to know and know pretty well what their needs are and what their issues are and, and how to help them, how to get hold of them quick. And that's been a big part of the success and I really value that.
Well, as you know, it's mutual. Anything you wish I had asked or any other reflections before we turn it over to audience Q and A.
You know, just the, you know, where, where would you like to see us go next? You know, in terms of capabilities and you know, I think I've shared a little bit of that. You know, to the extent that we can, we can tie into more information and get the same kinds of insight and capabilities and support, you know, that that would be my next biggest request is, you know, let's, let's keep expanding this thing so that we can do more and more and make it, make it kind of a one stop shop along with our computer maintenance management system and our ERP and shop floor system. Right. I'd like to keep everything boiled down to as tight a group of applications as possible so that we don't have these one offs across the network.
Love it.
I guess that was my plug. So much a question.
Love it as always. Awesome. Well then Derek, I might hand it over to you for questions.
Awesome. Thank you so much, Lauren. Thank you, Glenn. And as Lauren mentioned, we're going to take some questions from the audience, but before we get to those, we wanted to remind you that we'd love your feedback which you can provide to us in our webinar survey and we use that to help improve our programs. And so now for the first audience submitted question we have here, it asks did different parts of the team react differently? And if so, is there any advice that you can offer on preventing or handling pushback.
Yeah, I think there was. The answer to the question is yes, there was differences and I think some of the differences came from the backgrounds of the people that were involved. Right. Some of our employees have come from, call them academy companies where, you know, shop floor systems and SCADA systems are kind of a way of life. And, you know, everyone's Six Sigma trained and lean, lean trained. And to them it was like, oh, thank God. This is like a breath of fresh air. Right. So for them, it wasn't really a tough sell. For others it was, I don't understand this. I can't control my mix. I can't control, you know, what color I have to go to next. You know, you're going to measure me, but I can't do anything about it. Right. So we started there and I would suggest that, you know, you engage as many, you know, allies as possible that have seen it. You know, especially if you can find a peer that can, you know, coach another peer that can be very helpful. Right. It's one thing for me to kind of, you know, drive it, create the vision, talk about it, coach. It's another thing when, you know, I think even more valuable when peer to peer can help each other, you know, and share their own fears and concerns. So I think, I think identifying who's. Who's a good ally to help you with the messaging is, is a really important thing.
And you talked about the economy a little bit ago. How are changes in the economy affecting your approach or prioritization?
Yeah, I, you know, for us, the way it's impacting us is, you know, labor is scarce, raw materials are unpredictable when they come in. So our ability to maximize the uptime on our lines when we do have both that show up at the same time, people in raw materials is, is really, really important. But it's also really important to be able to articulate, you know, if we do miss an order, you know, we don't produce, you know, do we understand why? Right. So that we can at least communicate and we can forecast that, you know, as things stabilize in those areas, you know, we would expect a certain level of performance, the return. How much is is economy related versus how much is our. Which how much is our performance related type contribution to the numbers? You know, I think I also mentioned that as things tighten up, having a more precise measuring stick, you know, measuring in a millimeter versus a foot is going to be more and more important to find, to find those next nuggets of improvement out there.
And you mentioned labor. Lots of People are being affected by labor at the moment. Do you have any advice for people dealing with labor constraints at the moment?
Yeah, I guess that's a, you know, a bigger question than just guide wheel. You know, we've had to be very creative, you know, about where we find labor and try to find in non traditional areas. We have a very successful program, for instance, in Salisbury, North Carolina where you know, we work with the local, you know, the penitentiary system in North Carolina and have a great program where we can bring people into our plants to fill openings. And what makes it a great program? First of all, we pay them the same as we pay any employee. It's completely respectful and you know, people are screened for who can come in. And we also have a graduate of the program that happens to be in a, in a leadership position. Middle, middle level leadership position. And they're able to help screen those employees and guide them as they come in as well. And also guide them to pay them the same as we pay any employee. It's completely respectful and you know, people are screened for who can come in. And we also have a graduate of the program that happens be to. Happens to be in a, in a leadership position. Middle, middle level leadership position. And they're able to help screen those employees and guide them as they come in as well and also guide them to get ready for release because they're accumulating wealth and they're going to come back into the workforce and you know, they have this opportunity and you want to make sure that they land, you know, safely back into the economy. So that's an example of just having to go out and, and find.
Different sources of people. But at the same time.
I think at one point we were hiring bodies too. And I think what we found was we were probably.
Destroying more value by just hiring people versus hiring the right people. In the end, it probably didn't help us and probably hurt us by hiring not the right people. So resisting the urgent just to fill a position because a person's available. I think we found that it's probably better to not do that. Make sure you get the right person and deal and manage the situation.
That's again not guide will relate. It's just my personal experiences.
Fair enough. Thank you. I think we have time for about one last question.
What are the most common mistakes you see made? And is there anything you've seen that anything you've seen cause problems or just not work?
You know, it's probably more of a technical thing and it has to do with the initial calibration period. And again, I don't want to get too techy on this, but, you know, the system is measuring power coming off of these CTs and you have to establish, you know, when you're running, when you're idling, and when you're down. And, you know, making sure that you get a good calibration across a fairly broad range of products is pretty important. So that you get, you know, good data out of the, out of the chute and then have a process to audit that to make sure that, you know, the, the trigger levels are not, you know, drifting and causing you to, you know, too much uptime or too little uptime because, you know, we're using this data to make decisions on. So, you know, there is maintenance that goes along with this system. It's not physical maintenance as much. You know, we don't touch the CTs, you don't touch the hubs. But looking at the data and maintaining the levels, really, really important, you know, to get the most out of this system and also to avoid nuisance alarms to people, which if you, if you address and prevent too many nuisance alarms, it can get aggravating and cause problems.
Glenn, Lauren, thank you so much. Appreciate your time.
Thanks so much.
Oh, my pleasure. I really enjoyed it.
And I hope everybody else in the audience will join me in thanking Loren Dunford and Glenn Munshaw for the presentation, as well as our sponsor guy. If you have any additional questions or comments, please don't hesitate to click the Email us button, which you can find on your console. And then please visit webinars.flexpakmag.com for the archive of this presentation as well as information about our upcoming events. We appreciate your time and hope you found this webinar to have been a valuable experience.
More from Lauren
From Davos to the Factory Floor: Lauren Dunford’s Guidewheel Journey | Culture Talks
Lauren Dunford of Guidewheel on Data-Driven Efficiency, Sustainable Factories, and Finding Champions