Reporting Deep Dive | HubSpot Admin HUG | May 2, 2023
Kit Lyman from HubSpot walks through the platform's reporting tools, covering data sources, joins, building reports, visualization, and advanced features like goals and attribution. Designed for admins who want to get more out of HubSpot's reporting.
All right, so, hi all.
Welcome to the HubSpot Admin Hug. Today's hug is a deep dive into HubSpot reporting with Kit Lyman, reporting project manager at HubSpot. After this event, you're going to walk away with a better understanding of your data sources and how data joins impact your report and how to pinpoint the data you need for your report. What makes your report visualization impactful and features in the custom report builder. And I hear there's some new ones coming, so Kit, go ahead and take it away for us.
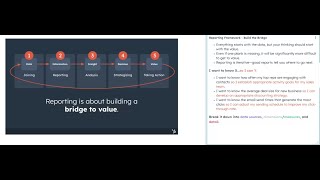
Cool, Let me get my screen share. So I love HubSpot. So I just decided I'm going to put everything onto a dashboard and use that kind of as our talking point. So just a quick brief overview. My name is Kit Lyman. I'm a product manager on the Report Builders team. So. So the two products that I own are the Single Object Report Builder and the Customer Report Builder. I'm based in Portsmouth, New Hampshire where I live with my wife Caitlin and our pup Chowder, who is right next to me. I've been at HubSpot for eight and a half years, so have stuck around for a while. I really love the product, love the people. My previous lives at HubSpot involved support, onboarding and strategic consulting. So I've kind of done the services trifecta before coming over to the product side. The HubSpot words I live by is it is all about the data. Always. Now I am in the reporting group, so I may be paid to say that, but I really, truly, deeply, deeply believe that today's objectives, just as a, you know, a further recap is you'll walk away hopefully with a better understanding of a framework to think about your data, how to break down the data you need for your report, selecting data sources and how data joins impact that report and then what, what makes the report visualization impactful. And throughout that, you'll get to see some features in the customer Report builder, whether they're new or incoming, that you may not have known about. So to kind of kick things off, I wanted to just give you a framework that I use when thinking about building reports. So with the whole flow here, right, you have data, which is unsummarized data, and you have to join that data to then turn that into information. Information is reporting, it's summarized data, but you need to analyze that information to gain insights, which then gives you a strategy that you make decisions on, but you're not able to get value unless you take action. Some things that I want to highlight here is that everything starts with data, but your thinking should start with value. Even if one plank is missing, it will significantly make it more value. Reporting is iterative, which means good reports tell you where to go next. You're going to finish this whole flow and then you're going to go right back to the beginning because you're going to have the next question that you want to have answered. Something that you can use to think about is I want to know X so I can Y. Which is why I say that you should start by thinking about the value because that's really going to help educate your report. So just some three examples. Here is one. I want to know how often my top reps are engaging with contacts so I then can establish activity goals for my sales team. Or I want to know my average deal size for new business so that I can then implement a discounting strategy. Or I need to know the email send times that have the most clicks so that I can adjust my sending schedule to improve my click through rate. It's really understanding what you're trying to get out of it because if you just build reports and there's no end goal, there's no taking actions and there's going to be no value. And the next piece of this is when you have this question, you want to break it down by data sources, dimensions and measures in detail. So let's actually start with just that first example. Right. So, and I really hope this is not super pixelated because I saw Diana's screen and hopefully it's not pixelated. It's not that bad. Okay, cool. So taking this question or taking the statement, I'm highlighting the data sources that are involved. So engaging is they're doing an activity and with contacts that is a data source as well. Now I'm going to talk about data joins and why I'm marking this as primary. So just hold tight on that. So once I've identified my data sources in my statement, because these are really the two key things that you want to know when building out a visualization. So a measure is really an aggregation. It's a count of something or it's revenue, but it is typically a number. But I want to know how often that is a measure of how many activities are being done. And my dimension is that I want to look at a top rep, which my understanding is that's the owner of that activity. Right. So these are my only two that I have marked in here. So the last step is really just identifying the detail and the detail is replaced is really in the activities. So I want to understand my activity goals. So that would be how often are they doing certain types of activities. So knowing all of this, I'm going to use this example when I go into the customer Report builder and I'm really going to build this out using this. But there are just a few things that I want to highlight because a lot of reporting is needing just foundational understanding of data and how data works. And I think that's really going to help when you go into the software and you're using the tool if you've got that foundational knowledge. So kind of think of think about it as like understanding the manual and then being able to use the tool. So the first thing that I want to just highlight is joins. Now I wanted to do a poll of like how many people understand what a data join is. But you know, feel free to just add some thoughts in the, in the chat of whether you know what a join is or not. But I really want to just highlight what primary and secondary mean because there's a lot of, there's been a lot of questions around how do they, why does this impact the report? So you want to think that every single report that you're building with a customer report builder is going to be a left join, which means that this primary data source is the most important data source for your report. And you're looking at everything in this left join table and then anything in the secondary data sources that cross in the middle. So if you want to think about this with a common example, we've got contacts. Contacts is my primary data table. Here's all my contacts, these are my contact IDs and then I join it with deals. Now deals you can have a one to many relationship with contacts, right? So you can see that I've got four deals that have a contact associated to it. But I've got this fifth deal that doesn't have any contact associated to it. So if I pick Context as my primary data source, it basically removes that deal because it's only looking at where is the cross in the middle. That fifth deal is over here and it's not related to the, to the contact. And we also can see that I still keep the contact that doesn't have a deal associated to them because it's going to be all of my contacts. What ends up happening once you go into, you pick your data sources and you go into the builder is you now have this joined table, this big long union table where now I have all of my information together and there is a relationship between those. Just think about when you're joining data Primary really matters because it may remove or keep certain records that you're wanting to keep in your report. Cool. The just the second thing I want to highlight is really kind of talking about that, like data to information journey, data is unsummarized. These are all rows. There might be the same contact or the same record. That's multiple times if there's multiple payments here. But summarizing data, which is what all reporting is, is aggregating it based on certain dimensions. And the other thing to keep in mind is that reports are valuable when you're picking your visualizations. You can have multiple summarized views. Here I have a total sum, which is also here. I have the individual sections here. But then I also have this percentage as well. I can now break that down and say, okay, you know, one time recurring is 38% of this. This visualization gets me both. So taking all of that, let's jump into the Customer Report Builder following this example. And let me actually just open up a new tab because I want to keep that dashboard open. Are you all still able to see my screen? Yeah, it looks good. I just want to make sure the window is still going. So going into the Customer Report Builder, let's remind ourselves what we're focusing on. Right, we're focusing on activities and contacts, but I only want activities that are associated to contacts. So that's why I'm going to actually have contacts be the primary, because I don't want to have any activities that are not associated because, like, that's what I'm specifically looking at. So I'm going to come in, I'm going to keep contacts as my primary data source and then I'm going to also select activities. And you can see up here what tables. Like all of these data sources, they're just data tables, right? They're just sheets of data. And you can see up here with what's included. Now this also.
One second you've got a bunch of people saying they can't see it, can you? To your screen, I can see your.
Dashboard, but I share this live instead. Okay, gotcha. I didn't realize I had to switch it over. Okay, So I just went here, picked context. It already was. Defaulted to that. And then I selected activities. So all of these different data sources, once again, you want to think about them as being like that table that I was just showing you. Now, when you select your data sources, you'll see up here what tables are included. And you also can Use this Data Join info tab to see how this join is happening. You can see I'm only bringing in activities related to those contacts. You can also see what drops off, right? We have some activities that don't have any contacts onto them. So great. It's doing what we want it to do. Once you've selected your data sources, you're going to come in here to the editor. Now, thinking about what you're wanting to report on is really helpful when you come in here and you're building a report. Because when you have multiple data sources, there can be a lot of properties and even like property management and just kind of cleaning up your data really, really helps because when you come in here and there's a lot of. And I will just say this is our demo portal that has so much junk in it. So it's like very overwhelming on all of these things I have to look at. But I already did the homework and I know that I want to have activity type. I look up that. For right now I'm just going to bring it into my field section. Sometimes I just drag it right into my configuration area. But for right now I just want to get an overview of all the properties that I'm wanting to bring in. I also want to have count of activities because that's the measure that I want. And you can tell the difference of measures and dimensions by the color. If I pull that in, it's going to be green. All dimensions are going to be gray. Now the other thing I wanted was Activity Owner. I think that that's what the property is called, but I'm actually not seeing it. I see this one called Activity assigned to. Now I may not always have the right label or the right language for the property that's in here. So you can always click on this little ellipses and open up View Property Info to get an idea about more about this property. So this right here we can see this is actually owned by HubSpot. So this is a default property on activities, which is great. I can also see that the majority of records that have activities have this. So I think that this is exactly what I want. And I'm going to bring this into my field section. I can either drag it or I can just add it to fields as well. Now the other thing, let me just check back on my notes. Activity owner, Activity type. I actually think I have everything that I need. So now it's thinking about how I want to configure this. Now, with the exception of the horizontal bar, every measure For XY visualizations, the measure is always going to go in the Y axis. I can bring in and you'll have some help text there. It'll say like you want to move it into the Y axis just in case you forget. But I've got my count of activities and then I want to start thinking about my X axis which is down here. I really want it to be the owner of that activity. And then let's see what this looks like. Let's also bring into the. I want to break it down by all the different activities that are going on. I just want to see what, what the chart looks like before I start to make some modifications. We.
While that's loading, we do have a couple questions on. Let's see, when are we going to be able to segment marketing emails based on custom tags that got upfooted a couple times?
Tags, What's a custom tag?
Nicolo, do you want to elaborate a little bit on that for us? Property, they're saying property that we can fill.
So I will talk about marketing emails. So maybe let's. Let's table that and come back to it.
That's a great idea. Go ahead and add that to the Q A tab, if you wouldn't mind.
Perfect.
I think that was the only one that ended up in the general. I think everybody's moving things over to the Q and A, which I think is a great idea so that you can keep moving forward. Go ahead.
Perfect. Okay, so I see this and I'm thinking this isn't super helpful because I have so many different names here and if I think about it, I'm really only wanting to know about my top reps. So maybe I'm going to make some adjustments to this first. I could change the way that this is sorted. I could say I want to sort it by the reps who have the best activity counts up at the beginning and then see how that looks. We'll find that it's still not really cutting down, it's just organizing it a bit better. Still pretty hard to see. I'm actually going to add a limit onto this. Adding a limit allows you to just size down your report because you don't need all these outliers down here. You really kind of just want the top so you can, you know, let's just do the top top 10 here and you'll see I can do by count of activities and kind of contacts. I'll apply that. Now keep in mind that I'm actually not using any contact properties in my report. I'm really just using contacts to have the join. So I'm only, I kind of xing out activities that are not associated to contacts. So I'm still only using activity properties in my report. This is getting a bit better. But as you can see, this is not very visually appealing because I have tasks in here. I'm actually going to add some filters, especially if I'm thinking about target goals. I really only care about calls. Oh, I don't want that. I want only care about calls, meetings and emails and I want email sent to contact and meetings and that's gonna just help me have a be a bit bit more visual and that's, that's looking a lot better. The other thing to keep in mind is I don't have any dates around this. I didn't really have that specification in my initial request. So that's why reporting is iterative because then you're gonna think, well, do we want to look at a month period? You know, we want to look at activity date when it was created. So I could say I only want to look at this quarter or this month. The other thing that you can start to think about is is this the right visual for us and what we want it to do? Maybe it's pivot table, maybe it's not. But there's other ways that you can kind of organize this and get an understanding of what people are doing. Yeah, so that's the first one. The second and third definitely can go into. They're going to get into more things like comparisons and different visualizations. But I wanted to pause and see do we want to have me continue building things those two other examples or do we want to kind of open it up for. For just general questions? I think it might be a good.
Idea to open up with general questions just because Bevy deciding it wants to be a little bit of a pain and it's not allowing people to upvote questions. So that's. That question is going to get super full super fast. Okay, so because we can't do it by rank, I'm going to go ahead and just do it from top to bottom. Anything that talks about future, I'm just going to go ahead and skip. Is it best practice to keep the number of sources for any report at a minimum?
So the more data sources that you click on, the more data, the bigger that union table is going to look. So if you're involving an event filter. So this is not an event filter right now, but there's limits on like time ranges because we put limits in place for performance reasons. So I think depending on it's really understanding what data sources that you want to be looking at. I do also think when you select data sources. So like let's say I wanted to select. Let's say I wanted to look at landing pages and companies, right? So companies. And you'll see down here companies aren't the ones engaging on landing pages. It's actually contacts filling out certain form submissions. And so you'll see that there's some supplemental tables that get added. So. So you can kind of keep track down here. Campaigns gets added, form submissions get added. That's why I call it Auto Join because we're kind of doing a lot of the adding data tables for you. But I think it's really just focusing on not adding a whole bunch that you end up not using. It's really only purposeful of how you want different records to be filtered out and what properties that you want to have access to for your report.
Also it's. Let's see. I'm gonna ask the one in General chat because it was at the same time you were building are there. Are you thinking something like new properties for campaigns that you could create a custom property. Oh, I'm sorry, that was an answer to Nicola me go back over to the Q and A. Let's see. It would be great if you can incorporate goals into the reports.
So that is something that I can actually cover that with my second example. Okay, so let's do. Let's change this report. Let me go back to my examples. So you want to know the average deal size do you have going on? So that's a time series report that's actually just going to include deals. So cool. I only need deals. I'm going to discard this and let's pull in. So I want to pull an amount. Now I'm just gonna. I'm putting currency we've initially we've put together. There's a formatting beta, it's a public beta that you can actually just add yourself to right from your portal if you're an admin and there's this option for currency and you can actually do full conversion. So these are pulling from all of my currencies in my portal. This cannot be done on any property that could have a mixed currency. So a mountain company currency is a safe conversion. So I highly recommend any reporting that you're doing just don't use amounts. Just use amount and company currency for that. Now I want to then pull in my close date. So time series you need to have a semblance of time period in order to put a goal on it. Now, I wanted to specifically look at average. So I want to change my aggregation to instead the average instead of the sum. And I'm probably going to use a line chart more often than not, or area, because those tend to be like, the best options for time series. Now, I will say this is kind of hard to read, so I'm going to be doing things in my chart settings. There's this option here called linear or logarithmic. Logarithmic just helps it be a bit more. You can see the scale just moved, and it's just easier to kind of see the differences. But keep in mind that, like these spikes, they're not as dramatic. Now, when you have a time series, which means I have frequency, a date field that is on my X axis, I can then add a monthly goal. Now, I recognize this is a static goal. So I can put, you know, let's say two, $20,000. You'll see that that static goal gets added. And there's been a lot of conversation about wanting to have the goals. So you remember setting up goals and revenue goals or calls made. Those are dynamic goals, and they're really specific goals where they have specific dimensions, filters, measures, and when you put it into a very customizable space, it just doesn't work. So there's conversation of how do we do that? How do we allow a dynamic goal to sit on data that doesn't relate to it? And so that's a conversation that we're figuring out. But you can do a static goal where you can change and add that in here, and it will show up whenever you have any sort of date, date, frequency down on the X axis.
Awesome. Yeah, there was a bunch of goal questions in the Q and A, so that's perfect.
Any different goal questions that are not the same as that one?
See if each month has a different goal. How can we add that to this report? So you can only add one goal.
That's. That's the problem.
Yeah. Trying to filter through all these.
About to get you with those.
I think we covered all the goals unless anybody. Unless I missed them. We do have a couple questions about data sets, so I don't know if you want to hit that next.
That's probably outside the scope of today. But essentially that is a tool that you can create really specific properties and you could do calculated fields. It's a really awesome feature. There was a hug that was done with Steven, who's the PM for datasets that I highly recommend checking out. But essentially it allows you to create your own data source that can be easily used and confined. Anyone who builds reports are only using those fields, those data sources. And it's just a bit of a cleaner experience, but you get much more with with calculated fields with formulas to my list. All right.
Let'S see. Can you explain a bit of how the event timestamp affects the time based report? So we're not really talking about a time based report here. I don't know if you have a intent to build one.
So that's, that's a great question. And it I'm actually going to go into my third example which is all around marketing email. So this is a public beta that also you can add yourself to if you don't already have that in your portal. It's called marketing email analytics. And more often than not you're going to want to also include marketing email data source because that is all the rich data about the email. And there are two types of date fields. There's one that's just like a date picker that doesn't have date time and then there's date time. Usually those are events. Right. So like if I open an email that's an event, whereas usually custom properties that you create and you're like stamping it in a workflow, it doesn't have a semblance of time date time and time based reporting and historical reporting is like probably the hottest topic that's going around HubSpot. I think it's really coming down to data availability and storing that data and understanding what events we want to track. But for date time properties which are going to be on all of these event data sources, you can break it down by the hour and the time period itself. This was talking about wanting to look.
At.
The best send times for open rates. You've got this date picker field called delivered date. I'm actually going to use a pivot table for this. I just find it's much better to look at. I'm going to bring in my deliver date. There's this option here called date part and this is for all date picker fields. Now, hour of day won't be available if it's not a date time field. But the difference between monthly is monthly is a time base, so it's sequential. Whereas date part breaks apart the actual date value. So for this it's hour of day, it's going to actually be 12:00am to 11:00pm Right. So I can use that Date part to, to really highlight that option. And that allows me to then pull in things like delivered rate, click through rate and actually start to see and translate what hour of day actually is the highest. Now this is also where sorting is really valuable because you want to determine how you want to sort this. And I basically want to look at the highest click through rate and look at that. I can also pull in like emails or campaign name in my columns to have that, that sort of stuff. But I think that does that answer the question about the time piece and kind of breaking it apart?
I think it does for me. If you ask the question, if you want to go ahead and. Sorry, can we confirm that this is hour of the day can only be used with HubSpot defaults and properties created via the API. UI created properties only use the actual date, correct?
Yeah. So custom properties like when you're picking. When you're like in property settings and you're picking as date picker and it's only, it's not a date time. So like that, that's been something that I've brought up of like, you know, if you're stamping it in a workflow, it doesn't capture that time and it's just like this default time zone. So yeah, it's all HubSpot default. I'm not, I, I believe that when you create it through the API you can determine if it's a, a date time property. But I'm not, don't, don't quote me on that. But I do know that the UI base, the, the custom properties are not date time, which is part of the issue.
And can we sort by performance was right before that?
Yeah. So you can sort by whatever measures are included in your report. I can't sort by something over here. I'd have to drag it in and use it in my report and then you can decide how you want that, how, how you want that to go. Something that we are soon going to release is this. I don't even know what's in here, but they've got, we've got this new, new thing that's happening. So before you only had value, which is actually like the internal. So if you think about like contact owner, company owner, there's kind of two values. There's the label which is the person's name and then there's like an internal ID of like who they are. And so we've added this label option so that it's actually going to sort by their name in alphabetical order versus their internal ID A lot of people who want to do like sales reporting and they want to you know, change the resort it by the region or by the last name that now is possible with, with this update that we're going to be hopefully I think probably pushing forward maybe this week or next week.
Oh, that's awesome. And I want to know if I can report by custom campaign fields. Now for instance, I have a campaign type.
So campaigns right now is not its own data source. It's that supplemental table that gets added on depending on what what you engage with. So certain things like emails or landing pages, assets that can be associated to campaigns also have a campaign table added. But the campaigns team is actively working on making it its own data source where you then will have the ability to select campaigns as a primary data source which is really what you're looking for where you can access all of those rich campaigns. Right now you'll just have to use what's available here. When I pick certain data sources, it's not its own data source but it is added on as properties that you can use. I can add on campaign name to this report where it's all under these are all the properties. But I think a lot of people really want it as its own data source which is actively being worked on by that team.
And she's. She did it and she can filter right campaigns which is what you're showing. But the, the next step is I think what the question was for. Perfect. We had a question in general. Is it possible to break down by unsubscribe rate with the marketing email analytics?
Yeah, that is a rate that we should shortly be adding. So there was just something that we had to to update with it. But that will be added on I think relatively shortly. But yeah, unsubscribe rate is actively being added.
And Drake asks for hour of the day. Is it based off the account default time zone?
Yes. So it is based on the portal time zone and a lot to think about with the like. I know that there's been a lot of questions around personalization of time zone and it really comes down to the data. If the data is available, we'd be able to filter by it. But if the data is not available for us, then we're kind of working with with what we have. But it is based on the portal time zone.
Gotcha. This is a little more general question. What are the biggest focus areas for improving HubSpot reporting both in short term and long term?
Yeah, I'd say outside of our specific team, I think just Overall discoverability and information architecture and how everything works together, really weaving a story of how these tools, you flow in and out of them. I think from our perspective, I have. My designer, Brittany is on the call as well, and she's probably answering people's questions as well. But she's. She and I are actively doing research on understanding perception of these two builders and, you know, thinking about futures of them. Just thinking about how we want to really consolidate and have people understand where they should go for certain things. And I think a second piece is really making all of that rich functionality visible and, and not. It's hard because we're doing a lot in the customer report builder, but I think a lot of people miss certain things and certain features that would be really helpful to them. So how do we surface that in good ways? I also think a big focus area is really around KPIs. So KPIs is essentially aggregate math. Aggregate math. Let me actually just highlight that just to contacts Lifecycle stage. And let's do a table. These are all aggregations. It's summing up all of the records that are marked as a subscriber. But then we've got this total number and people want to use this total number. This is an already aggregated number. So let's say you wanted to do like percent of contacts that are subscriber, you would need to take this number and divide it by this number. So having that ability but being able to also be able to just swap in and out properties is a rather challenging problem that we're actually very close to solving for. And I think that you'll hear a lot of updates around KPIs and how we're using data sets for building out aggregate math in the coming months. So I think it's really exciting. That's, I think, a huge focus for me in reporting because As a consultant, KPIs and metrics are so important for businesses to understand their success. And that's a huge part. Especially if we think back on our journey of our framework and insight is really that KPI and that allows us to have something to really analyze easily. So I think that's also another big.
Focus that's kind of a good segue to. There's a lot of requests and a lot of questions on the best training and documentation to be. To be aware of all of those amazing little nuggets and things in there besides obviously hug like this.
So question back. Actually we can't talk, but I think there's two things to call out. One if you're wanting to keep track of all of the awesome updates that are happening around HubSpot, you definitely want to be keeping an eye on product updates. This section is where also you can enroll in public betas, but you also can see all of the notifications that come out of what's new, what's what's Sunset, what's a new beta? This is going to be a really great spot for you to keep track of all of the great work that the product team is working on. I think this is a great way to stay up to date on features in terms of training and resources. That's something that we're talking about. And there is a great reporting certification that's also going through a revamp. I think it's going to be coming up in the next few months. But lessons around data literacy and foundations of data and how you want to think about your data because as I said data is. It all comes back to data. Your reports are only as good as the data that you have. So I think that's going to be really helpful. Outside of that, there's knowledge based articles, there's two knowledge based articles for R specifically of using the Customer Report Builder and understanding the Customer Report Builder. But I think the other thing that we're looking to have is more use cases, more scalable use cases that instead of it being just report templates that are a question and it answers one at a time, you know we more of have some more starting point that you'd be able to answer more questions all from one example.
That's great. And don't worry everyone, I know there's been some glitches and things like that. The recording will go out and if you want to put your questions in the Q and A, I will make sure anyone's we don't get answered on here will make their way over to Kit and maybe we can invite Kit back to our huck. Let's see what else we got over here. The the single object builder can only create reports using one data source. The custom report builder can create reports using one or more data source. I'm not sure where the question is on might be an answer to a previous one. Sales goals, lots of documentation. Is there any way you can show in a pivot table the percent of the row total or column total?
See that would require the aggregate math piece that right now we can only do row level math and what you're wanting is to be able to do column level math. So that that's what we're we're looking to get with at GRIT math updates. Yeah.
Review attribution. We talked about that. I think I covered most of those in some way shape or form customer journey reporting. You're not talking about that, correct?
Yeah, no, just I, I, I could but I may not be the best person just because that, that builder is owned by a guy named Davis.
Yep. I got, I have it on my notes everybody to get someone here to talk to you all about customer report journeys. Let's see. Would you be able to walk through a building report that attributes revenue to different website pages specifically with contacts whose source is website or marketing.
So that would, and I can speak to it. It's not specifically the customer report builder, but that would be more of an attribution report. And I kind of think about, the way I think about these two is that these are table based builders and then these are more like supercharged analytics tools. Especially with attribution. Like you can't select all of the different data sources that you could hear. There's more guardrails. But it, it, it serves a very specific purpose. So if you, I think what, what was the, it was revenue. Let me check. Can you replay? Yeah.
Attributes revenue to different website pages specific specifically with contacts whose source is website or marketing.
Gotcha. Okay, so what you have here is you have three attribution types. You've got contact create. So like what created contacts or what created deals and then what closed revenue. So you can start with some of these examples to like get you started. You can also create a report from scratch. This type, this option kind of gives me a starting point and it's really kind of playing around with it. So you were saying what website. So that's asset title I would imagine. And then we probably would want to have asset type of just website page. And then this is where when you have like a more specific purpose you can't do as much. So like I don't know if I'd be able to add a filter of source. So I think what was mentioned was like source type.
Yeah.
And see, I don't have that field available. Maybe you could do UTM source because this is kind of the standard sources. So this is where you would kind of have to play around and see what fields that you have available to you. But you can start to see, okay, I've got on my X axis I've got my website asset names, I've got my revenue and this is closed revenue. But also keep in mind that it really does matter based on your attribution model. You can read the models here. Most often people like to do linear, but you could do first touch or last touch. I could say, what was the first interaction that we had? I could just add that as how I want to attribute the revenue. But it's going to come down to what do you have available for changing your standard filters, your dimensions? This is always going to be revenue because it's a revenue based attribution report. But you have the ability to change how this is looked at as well. The other thing just to keep in mind is when you click into these bar charts, you can drill down and group this data in other ways. I could say I want to. Let's see what we have. Okay. We don't have any source for utm. Also keep in mind this is a really, this is, this portal is really bad data. So it might not be the case for you. So I would recommend like exploring and digging around to see what's available. So some of this like reporting is exploration, right? You're not going to have all the answers when you start building reports. Sometimes you might want to see what's available. This is kind of a good trick to see what, what options that you can use and then, you know, pull that into the additional filter down here.
I appreciate you diving into other areas. I know. I mean, reporting is such a large topic and it's so hard to segment it by how the system actually does it. And you know, at least in my brain it is. And I'm like, oh, I just want to know this. And then you have to go, okay, how does the system dissect it? And.
If we're on the topic of attribution, I did want to just highlight something. In Settings, it's under tracking and analytics. You have an option to customize what gets attributed or added to your attribution model. You can turn on and off different aspects. You also can see what's available to you in terms of what's happening on sales, what's happening on marketing. Custom behavioral events is honestly a great way to get date time type of events that are happening. So I also think for all enterprise customers, take a look at that. This is something just to highlight when talking about attribution as well.
You got lots of love in the chat, just so you know. I know you can't see it as it's going by, but you tell my favorite presenter ever tell Kyle he's got some competition. So just so you know, everyone's loving everything you've got.
We do.
I have the survey. It's going out to the chat. So meeting with a rep.
That would be a journeys report. Because Journeys is about cause and effect. But once again it does come down to what data is available and that's where is. Is it Tracking is the lead status. Like tracking like property change. Like when they become a lead, it's.
They're saying off a conversion. So meeting with the rep could. It could be an activity, could be.
A life cycle change where you would be able to. To. I can show it. It's not, it's not like you're not.
Allowed in that part.
Total justice. But I, I'm not unversed in it. So Journey custom Journey analytics is available for marketing hub enterprise customers. But there's talk about expanding into, into different data sources. So right now this is all contact focused. So we were saying let's say like a meeting. I think there's meetings in here. So like I book a meeting, I then a convert. What is conversion is that. That can mean a lot of different things. Is that like a deal is created. Let's just pretend it's.
Sounds good.
Open a deal, gotta be a deal stage opportunity. Huh. I don't know. I think deals is maybe coming, but I could use opportunity to say okay, how many meetings get booked? And let's actually say that they were like a lead before I could put it above it and let me just run the report to get something to show. I start as a lead, I book a meeting. You can add filters onto this too. You can say the meeting owner or the meeting source. You can really drill down on this particular step. Now I am making sure that each step is required. I can mark steps that are not first or last as optional or which then changes some of the trajectory. Like you know, let's say if I mark this as optional, you'll be able to see okay, how many people went from a lead to an opportunity that didn't book with a meeting. And because this is dealing with events, you've got to refresh the report each time you make a change to it. But it's super cool because you can see different pathways. So it looks like 28 of them and nine people who booked didn't end up going on to opportunity. So not doing that great on that meeting. That's kind of what we can see there. There's also options to journeys. Oh, I gotta basically make it required and then I can turn it into a funnel. I kind of like the vertical funnel. I think it's just easy to see the conversions. Oh, I meant horizontal Funnel, I just like the conversions on there, but you also got these great recap steps here. The other thing that they're adding, which, yeah, it looks like you have this option if you click into the contacts, you also can click on using a list and then that would open up the list tool as well, which I think a lot of people are excited about. The one last thing I'll mention is especially if you're, if you're doing like website, like your webpage was visited and the form was submitted, you are only seeing contacts who visited the website and filling out a form. But there's this option up here where you can include anonymous visitors, which is awesome. This won't actually change the report because they're all contacts. But if you have like, if you're looking at websites and the full funnel that gives everyone, not just the contacts in your CRM. So I think that that's really special. But the main focus here is just getting more data, more data points, more events because that's what you then can just build out. I believe you can have up to 10 steps in here. So it's really just a super, super slick tool. There's also this demo if you wanted to see and you have access to this. So also something to keep in mind.
Awesome.
That's great.
That's pretty awesome. We're getting towards the end and I know there's still a bunch of questions you've, you've touched on everything and I really appreciate that and like I said, I will consolidate all the questions in the chat and make sure they get over to you and hopefully we can have another chat like this again. Is there anything that if you just had to give admins like the top number of things that they should really focus on when they're looking at the report builder, what, what, what should they just really dive into? So.
I think main things to just keep in mind is just pulling some things here and I love that you're.
Doing it all live by the way. That just shows the confidence and you know what you're talking about.
So I really, I do think it all just comes down to like having like some semblance of a framework and understanding what you're wanting to get out of it and, and what the report is telling you. Because really the goal of the report is to you set it up and it, it works for you, right? A lot of the time you're probably going to want to do to set up like rolling date filters. So rolling dates is the ability to like say I want to look at this month. And so you have filters that can dynamically update with you and you don't have to keep making these changes. So using that, I do also recommend checking out all of the great filter rules. This is the most expansive filtering section where you have access to join so many different data sources and essentially pull in records. This is the most flexible space that you'll have in all of HubSpot. So if you haven't used the customer Report Builder yet, I really highly recommend you give it a try. And if you've got feedback, always find channels to do it. My team and I, we really read everything and it all matters. It all goes into prioritization. But using checking out different filtering options, I would say there is going to be a lot of options in this edit field section. You can rename things, you can have add aggregations. You've got the date part. If it's a date picker field, you've got sorting and limiting. That really helps clean up a visualization. You'll also be able to on here, let me actually go to, let me change this filter because I wanted to show something that you can use like this zoom feature. So if you wanted to kind of like really go into certain details, like you can use zooming instead of filtering. If you wanted to keep everything all in one place, you can reset it by going here. That's something to note. I do think knowing that there's property info to really understand, you know, how many, what's the fill rate of this, how many, how many records have a value for this? You can also add it to fields right into your report. This also can help you figure out what needs to be cleaned up if there's duplicates or you know, something's just not, not working well if it's just for reporting there, I don't want to talk too much about it, but just keep an eye out in the next month for formula fields. It's going to be the ability that you can create reporting row level calculations, but you can create reporting fields on the fly. It's using the same expression editor as in data sets. So you'll be able to get a taste of data sets. But that's going to be a really, really great addition where you can have fields just for reporting purposes and not clutter up your property settings. But that's something to keep in mind as well. Otherwise I think it just really comes down to the data and finding the right visualizations for yourself. Certain visualizations may be scary, like scatter plots. Once you get the hang of it. Super awesome Scatter plots allow you to have two measures and you compare against it. The typical scatter plot is like age and body weight and like are they related? If you're older you gain more weight. You can do things like average deal size and the amount of discount does that impact it? So there's a lot of really cool things that you can do with different visualizations. So just never, never shy away from that. I don't know if that's if that actually answers anything. Hopefully there's some some tidbits that can be taken away.
I can tell you blew my mind with the zoom in feature. Didn't know that existed.
Yeah it's really.
I don't know how but just wow. Crazy. Yes Patrick, we will be sending out the recording. You definitely were. You're going to want to go back and watch it. You. You missed. You missed a good one. Sorry apologize for whatever you had going on but Kit laid out all kinds of amazing stuff. What else? Let's see we'll be able to report for versus the future. I'm not sure what that means Cersei, if you want to add your add some notes on that. Let's see some social media reporting questions which we talked about before Recommend reports. What do you recommend for some additional report training other than the academy like besides all of the the resources that you've pushed out there. Do you know of any maybe boot camps that might be coming out on reporting or anything like that?
We're talking about it. We're. We're. I think it's it's a bit thin right now that we're finding the best ways knowledge base you know keeping keeping that up to date the reporting certifications getting a revamp but I think it's also about having more how to related videos and we're also discussing and figuring out what what we can do in app to support things a bit better and help guide so still still figuring that out. I think the main avenues of knowledge base and academy and like things like this you know I want to continue investing in and it's also working with our services teams who work with all you great folks and and partners and everybody to have people understanding the best practices and everything going on and coming up I realized that I can access the chat by going to my third tab. I did just quickly see will HubSpot add median reporting? Yes we're actively just adding median reporting. It's essentially the ability this is not a great one but on aggregation you could do mean we're going to be adding median. It's on our list, actively being worked on.
Awesome. Very cool. Is, if anyone has any additional questions, is there a best way to reach out to you? Is it LinkedIn? Is it email?
I'm still not on LinkedIn. I am, I feel, I just, I don't really check LinkedIn. I would say community is great. I, I, so I used to be a consultant and, like, love answering questions, but I also find that, like, I could get myself in deep water by answering everyone's piece. I think, honestly fill out that survey. If you have any questions, I will see them, I will read them, and that will go into all of the resources that we're thinking about. I also think community upvoting, creating new ideas, that's where we're, you know, me and my team live and update. I'd be happy to, if there's interest to do another one of these and we can kind of keep it just. Overall, AMA and I have no problem answering, answering things on the fly. I apologize for anyone that I didn't get to answer their questions. They're all very great questions.
Bevy didn't make it any easier and there was tons and they were scrolling by and I was trying to sort them. So I, I apologize. I take that on myself. I, you know, I wanted everybody to join us, but then I guess I bet he couldn't handle it in the end. No, but I appreciate, I appreciate all of your information. You've shared all kinds of things, things that, I mean, like, like that zoom. There's tons of us in here going, what? How did you do that? Like, I've never seen that before in my life. No, everything you've shared is great. And I, speaking for myself and the person who actually gets to schedule these, I want you back. So I will make sure you come back and we'll get you some questions ahead of time. I think that might help and be something a little more beneficial for the group. So I really appreciate that. And if anybody hasn't joined any of the, the other hugs that are coming up, definitely keep that in mind. And don't forget to fill out that survey. Thank you so much, Kit. Really appreciate all of your expertise and thank you for making such a great event. Have a good one.
Thanks, everyone.
Bye, guys.
Sam.










