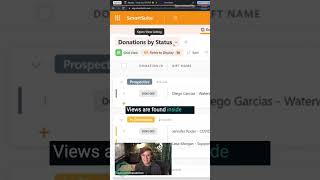
This is a YouTube video titled "Use SmartSuite for Reporting Data" containing a tutorial or explanatory talk from April 22, 2023, about using SmartSuite's reporting features such as dashboards and chart views to analyze CRM data. The content involves a speaker explaining how to utilize these tools for customizable reporting within the SmartSuite application.
Inside this CRM area. We are using fields like amount of the donation, contact and other things to actually give us reportable fields. We could then summarize using SmartSuite's reporting. So given we have all this rich data, we want to start reviewing it. Which is exactly where dashboards and chart views come in. What the heck are these things? Layla, you're hyping them. What are they? Well, these are types of views in SmartSuite. Views are found inside your apps, which is this kind of bar here. And if you go over to this left side and click on the little caret, you'll see all of the views that are added into your relevant area. We can add new views using the plus icon here, and particularly today. What we're looking at are two types, Chart View and Dashboard View. When it comes to customizable reporting inside of SmartSuite, these are your two best friends.