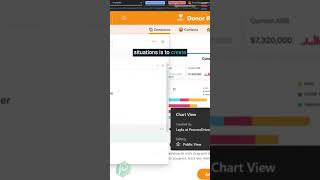
This is a YouTube video titled "What are SmartSuite Dashboards?" containing an explanatory talk from April 20, 2023, describing the features and usage of dashboards within the SmartSuite platform, focusing on how to create and embed charts for reporting purposes.
Dashboards in SmartSuite are kind of like charts on steroids A dashboard view in SmartSuite looks something like this. This is a flexible canvas where we can not only create simple charts but also embed information stored elsewhere in SmartSuite. The complexity level of the charts you can create right now in a dashboard is quite different than the charts you can create in a chart view. Your best bet in most situations is to create your chart views as state standalone views and embed them. What I mean here is take your view that you created elsewhere with all the superpowers you added and use the embed chart option right here. Select it from the dropdowns available and have it show up on this dashboard as one little piece of a broader report you can create. When most people are thinking about reporting, this is the kind of layout that they will be generally working in. Is a dashboard like this where we don't just have one pie chart, one big old chart? No, we typically have multiple moving pieces.