What's New In Reporting | HubSpot Admin HUG | October 10, 2023
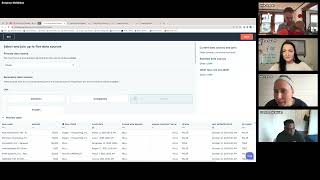
Kit Lyman and Stephen McMillian walk through HubSpot's new reporting tools, including data sets and the customer report builder. They cover data joins, calculated fields, summary functions, and AI-powered formula creation, then answer questions from administrators about packaging and future updates.
There it goes. All right. Hey, everybody. Welcome to this session of the HubSpot admins. Hug. Super excited to have Kit lyman and Steven McMillian here to talk about new reporting things inside of HubSpot. Without further ado, I'm going to mute me and my baby and pass it over to you too.
I can kick off introduction. Howdy, guys. My name is Stephen McMillian. I'm the product manager for data sets and at HubSpot. Going to talk a lot about data sets today and also talk about data sets and report builder work closer together. I'll ask the kit for an instruction as well.
Yeah. Hi, everyone. I know for some of you all that attended the May deep dive with reporting, you're familiar with me. I'm the product manager for the customer Report Builder. Going to be tag teaming with Stephen today. The main focus is going to be around data sets, which just because we covered so much of the report builder in the May session, but going to be in the chat as well as hopping in if needed, depending on where the conversation goes.
Cool. All right, so I have some content prepared, but I love being interrupted with questions as I go. This is only as instructive as it is helpful for you guys. If you have questions about things that I'm glossing over that I can spend more time on, I'd love to take those in the moment and then we'll see where we get. Might not use a full hour, not really sure, but I would love to start with a quick overview of some of the basics of data sets. Just starting from the join screen and then going through some of the functionality that's already existed. It's pretty hard to jump into the net new stuff without making sure everyone has solid context into what's been possible for a while. Wait, I need to share my screen, don't I? Share screen, Chrome tab window. Can you guys see data sets kick?
Yeah, we're seeing data sets. We'll keep an eye on the chat and let you know if anything comes up.
Nothing I hate more than I can't see anyone's face. I'm talking for an hour. Now we're in data sets. Get to data sets, the reporting data management data sets and it'll bring you to the same page. If you've never actually made a daisy before, you'll basically just be met with a few templates that allow you to kind of get started a little bit quicker. But you wouldn't have all these because these are data sets that myself, my team have made while we're Testing in my test portal. To start creating a data set, you can either click the button in the right corner Create Dataset or you can start from the template. I'm going to quickly start from a template just to show this new flow because it is new. So this is different days of templates that our team is building and putting the portal.
Steven, just a quick request. The screen is a little bit small. If you could just zoom in a bit.
How are we doing at 1?
That looks pretty good. Let us know in the. I think that one closer zoomed was perfect. Yeah.
Okay. I'll try to remember that. Starting from templates I click See details. I can read a bit about what I might get from these templates. Right now there are only two templates. We're planning to expand these really as people give us feedback on what might be more helpful. But let's use this closed loss analysis one. Just get started. Use template. What this does is actually splits you right into the middle of a billion data set. It chooses the data sources. There are preselected fields that you might use to build a data set. These are based off really common fields that most people across all portals are using. Then we add a couple of different fields here based on calculations that are preset for you. I just want to show this flow exists now because it previously didn't exist. But I actually am going to go back and start from scratch just to make sure that everyone has the same context throughout this whole presentation. So exit the page. Let's start from scratch with Create Dataset. So the first screen you would generally see is this data join page. From here, what you're doing is you're selecting the tables that matter most to you. This is like a SQL statement where you're like doing a join of table one to table two. So here I have contacts. It's trying to give a preview of data that we believe is important view just so you understand what is in this data source. But let's say if we start with deals here, it's selecting all 22 deals in this portal and then it's making this is only one table. As I join other tables like companies together, it's making a left join. So it's taking all of the deals in this portal, all 22, and then it's looking at all the companies, all 16, and it's join those into one table based on any known association. So the rows that are Included are the 22 deals and the four companies that have associations to these deals. There actually aren't associations with about 12 of these companies just because this is a test portal. So that is the first step of building a data set and let me actually change portals here. I want to use a QA portal kit. Any questions I need to answer right now?
I think one of the questions that's come up that I was just writing back in about is asking about where does Data set sit in terms of our pricing and packaging and if they don't have ops of enterprise like what is relevant to them, why is this valuable to know? Why. Why should they care about data sets if it's in a. In a hub in addition that they don't use or have.
Yeah. So a couple. What can I divulge? So Data set sits in operations of enterprise and it's like used to powers from the reports that are built in the customer report builder that sits across our pro platform. So pro platform is context meaning like any of the verticals between marketing, sales. Marketing sales. I think service. I'm actually not really sure if we have access to CMS HubKit but it's logic power those different experiences and data is really trying to give more power to that entire report experience by giving you more control of driving new data, making reportable tables that have more governance and allow for you to be more specific about who sees what in your reporting schema. So it wouldn't be relevant to everyone across all of random reporting if you don't have operational enterprise, but it would be relevant if you're trying to figure out like why would I evaluate this new higher, more expensive SKU and it will be valuable for me like that's what I'm going to go through today and it should be relevant to those people. Any other questions? Did I frame that right, Kit?
Yeah, a lot of questions coming in. Hard to keep track of them all.
So.
One question and this probably was back I think on the screen. So is there a way to reverse engineer to see properties not associated? I'm guessing that this is related to data joins and wanting to do a different type of join. So like an outer join instead of a left join. I'm not sure if that's specifically what Isaac was was asking about.
I table that for now. Yeah. Because I think it's pretty specific question just might not be relevant yet. And I want to get to the basics before you get into things like curtailing and hour joining using filters to narrow down. Yeah, just the first example walkthrough here we're going to use deals. Keep it simple. Next screen here you're constructing a Table that gives you all of the reportable columns. If you were to make a report off this data set, it's going to add some columns here to fill out. We're looking at deal name, stage name, date, date, close date, type. What else is relevant here? Owner, amount. I think we can stop here. Basically what I'm doing now is creating a table. If I were to go in the customer report builder and build report off this data set, I would have a total of just all the columns I've dragged into this dataset view. This is all we have to work with. From here. I would like to start creating more fields that might be helpful for your reporting needs. I actually want to start, instead of talking about some of the new stuff with our summary functions, I just want to start with some of the basic examples of row level fields that you've always been able to create with data sets just using the amount in these columns. So amount, looking across the row, I can go amount. I can multiply the amount by whatever numeric literal. So amount times two. What this presents is it looks at the amount here and it adds. It multiplies by two to get 300,000. And you can do this for any of the fields here and you can definitely use other functions that might be relevant. So imagine if I wanted to look across one row and understand new information about how many days between the create date and close date. I can use a row level function like datedif. But datedif I must specify I want the day, the month, the year, the seconds, and then I select this argument day comma, the first thing starting date value to subtract from day two. So the starting date value would be the create day of a deal. Second date value be closed dvd this tells me how many days are between the create date and the close date. So I can say days between create and close. A new way we can do this though is using the new formula AI experience that we have. I'm going to close this field and make a new field. Imagine I want to do a very similar thing that I want you to understand. How many months between the create date of a deal and today? So let's see, I'll just type this in as a question. How many months between the create date of a deal and today Generate hopefully gets right. All right, so what I did is the same thing I just showed you with the date diff and days and said datedif Instead of days, it used the date part month, took the create date of a deal and then it added a second function, nested within this date. Diff now. So this is returning how many months between the creation of a deal and today versus the close date? So days between creation and today. This is what it's doing. This whole formula experience is it's taking our best guess at translating your human readable language into a formula. And also we're trying to figure out different ways to display other information. Right now it's focused on just formulas. We're trying to expand this to do things like correct this formula for me, tell me what this function does and how I should use it. The AI is really great at doing that. We're just trying to figure out the best way to display that information as opposed to putting it all in the formula field. Quick pause here for any questions I'm missing in the chat. Get.
Yeah, so one of the first things I've been answering a few questions, but something that I think is worth talking about is a calculated field versus a calculated property. Calculated properties is something that customers know is available as a property type, as a calculation in CRM settings. And so Caleb asked, could you talk about the abilities or roadmap to allow the use of calculated calculated properties in custom objects? And so that kind of shows that there's a confusion around calculated fields versus calculated properties. And just hearing from you about why those two are different.
Okay, let me make one more field and I'll talk about this using the customer Report Builder, because I think that's the best way to contextualize it. So maintain. Just launched was new summary fields. These were row level fields that looked across a row to compute new data. Now we can look across one full column and then compute new data based on averages, sums, counts, etc. I promise I'm actually getting to the calculate properties thing with this train of thought. So imagine I have all these days between creation, create and close, and I want to see what is the average there. So I can take this field that has no information. I can say average of days between create and close. Average, create and close. This is looking across the whole table and it's telling me what is the average? Approximately 80. Now, as I move into the customer Report Builder, Save and build report, I'll talk about those theme properties and these dataset fields. Let's use a pivot table. Okay, so the noble difference between properties in these dataset fields is a couple of things. Dataset fields are created on a data set and they're not being automatically persisted into your HubSpot CRM. So imagine I'm just making a bunch of these Fields Days between creating close, Days between creation and today, months between creation months, sorry, months between creation and close. I can make like six or seven different fields and really the only reason we need these is for reporting. So instead of saving all of these fields back to your deal object and kind of clogging your CRM with different properties, these are just sitting on the data set and don't have to be sitting in properties that might never be used again. The second thing, roll up properties are often very useful for taking the sum of sum of deal amount across some association layer or the average of create risk close. But in HubSpot Custom report Builder we can't use those role properties and that's based on some back end limitation that we need to be able to recompute the value while making the report. Here if I take the average of creating close, it's giving us that 79 number that we were looking at in datasets. What I mean by recompute is we don't want to roll this value and just spit out a number. That's kind of like how the property system works is it rolls with the value it tells the value is 79 and then we can't break that value down because we don't know all the underlying context of that number versus the customer report builder. As you're building a report you might want to freely drag and drop new dimensions into these rows and understand what is the average create versus close of new business deals or renewal deals. Sorry, this data is weird. It's in a bad portal. This is all testing portal or I might want to understand the deal owner. What is the average days in create and close for a deal owner? So we actually don't want this pre computed value that is rigid. We want a measure that is flexible and can work with the context that we need to look in our business. And that's a really prime difference between the calculated property system and data set fields or in the future like formula fields and customer report builder is the ability to be flexible with with results versus being rigid and what we call operational. Did I answer that question? Fine. Kit, were there any follow up questions?
I think there was one of just talking about those fields created on reports are set as new properties on HubSpot. Question mark and what would be the difference or benefit in doing these calculations on a property and add it to report which I think you got into with the roll up. Yeah, I think that it all covers it.
Yeah, it has to be more like descriptive about what why is an actual benefit to have things only persist in a data set versus the actual object field. Imagine that we were making a formula field and this formula field is called priority. So I'm going to use an if function and say that if the view amount is greater than 50,000, then let's actually make it less than 50,000. That's inequality. Then call it a SMB deal. Otherwise call it an enterprise deal. So within the context of this data set that we're making for a hug example, this is how I would set priority. But imagine that I had a field, my CRM, that was called priority. It was not contextualized in any other way. And within our system, anyone could look at this priority field and not really understand why it was created. Imagine there were probably five different ways you want to create a priority based on whatever data context you have. Right now we're looking at deals. So this deal is. We're looking at deals and maybe I want to make a filter for one deal owner in my portal. Maybe the priority for deals for this deal owner, this sales rep, is. Is different than priority for another sales rep. And I want to represent that through a different data set. So it gives you the ability to be really specific with your logic based on the reports you want to create off this dataset without clogging the CRM with six different priority fields called Priority 1, 2, 3, et cetera, and kind of confusing anyone that was not the creator of that field. So this is like a really important thing for data governance. As I was talking about a little bit earlier around having like the specific information represented in a specific way in the one in the place where we want to represent that logic. Any other questions? Kit, I'm going to move on to talking about some functions a bit more.
Yeah, that's, that's a big one to talk about. Just a quick kind of wrap up on the calculated fields and calculated properties piece. So a question around. Are the functions available in data sets different than what calculations can be done at the property level? I'm confused on that. So just kind of talking a bit about like the difference between calculated property, what that, you know, purpose and function is versus like data sets, calculated field, if that makes sense for, for your direction of the talk.
Yep, I own a quick way and then move on. So a lot of the row level functions of the calculated property system are very similar to data sets. There's like an if function, calculated properties, there's an if function, data sets. The calculated properties team separated their row level functions and their summary level functions into two different experiences. As against this next example about computing a conversion rate, the differences of how those systems really work will shine. Where in one system, the reporting system, you can combine an if statement with a sum statement to make a sum if statement. And then everything I'm computing is flexible in the customer report builder, which I'll show versus using a calculator property, where you must be specific about first making an if statement in a property, then you have a sum function on top of that property and making a second property. And then none of that is actually usable in the customer reporting system. Because that flexibility layer that I was talking about where in the calculated property system, they spit out the number 95 in the reporting system, we need to know how to break down this number at 80, 18 different ways by any given property that we put into a report view. So it's really different use cases. The best way to really sum it up is if you want to do data modeling and calculations for reporting, you should probably tend to use the reporting system. If you want to use functions and properties for your operations within workflows, all those things, you should probably go to the calculated property system. And that's like the easiest way, the simplest way to think about it. Even if it doesn't fully, it's not fully true. It's like the simplest way operations, first reporting, use the tools and either kind of habitat get your job done. Okay, sorry, just real quick, before you.
Move on, a couple of questions we're getting. So the, the summary calculations you were talking about, that's currently a public beta and people can opt themselves into it. The AI powered formula creation, is that also a beta? But I'm having trouble finding that one even though I have it in my portal.
Everyone that has access to data sets should have access to everything I'm showing today.
Okay, great.
Yeah, cool. I'm going to talk more about summary functions and how they work. Look at my example list. Okay, first I just kind of want to show like how a summary function works in the most basic level before we get into a conversion example. How am I doing on time? 10, 30, almost. Okay, so sum amount, average amount. Okay, so I've made two summary fields here for a sum of the amount and average the amount. We look at this in the dataset, it just shows number repeating on different rows. What's actually happening here is this is just defaulting to whatever the summary of this column is in this table and it's defaulting to the average deal amount in this table. And this will remain the same until you bring the Data set into the customer report builder. Once we're in the customer report builder, let's update, save and build report. Let me close this out so I cannot confuse myself. Use a pivot table. So here I have the average of deal amount and I have the sum of the amount. Same numbers we were seeing in the data set builder because there's no dimensions added to the rows or columns configuration slots in this report view. As I add more dimensions like deal owner, it will break down these numbers. I give it a second hopefully here weird. It'll break down these numbers based on each deal owner and then it will represent the totals at the bottom here. So here all the deal owners, my portal. Here's the average deal amount per deal owner. Average deal summary deal amount for per deal owner. This actually works the exact same way that just using a sum of amount would work. So as you can see here, these two values are the same no matter what. So that like asks the question like what's the value of doing this in datasets versus in the customer report builder? So that's what I kind of want to talk about is how would you use the summary function again, additional value versus just kind of doing the same sorts of things that you've always been able to do in customer Builder. Back to the data. Talk about that. So the real value of summer functions is combining them together with row level functions and combining everything together to make fractions and ratios that are important to your business. So I'm going to show you how to create a conversion rate, a sales velocity, then how we can use those. So to create a conversion rate we need to understand if the deal is closed or not. If closed one is true. If deal is closed one and this equals true then return one otherwise zero. I think this. Yeah, this worked solid one and then I'm going to take the sum of this. This is basically just doing a sumif and it's looking at the portal again defaulting to the table and saying there are 253 deals that are closed 1. To make this converge rate, I put this as a fraction where I do. Again, if we're going to say closed equals true 10 wrap this in a sum function the same way if deal is close true. What did I get wrong here? Oh, let's see if Stage name worlds. What is the stage name? That's close. Lost close. Let's see how this represents. Equals true 1 or 0. It's not liking the way I'm trying to represent this for some reason. That is annoying. I'm going to go to my backup plan here. Look at this. Always been backup plan. Here is the win rate I was trying to compute. Not sure why that's not working. I'm in a QA portal, so weird things happen. But here's what I was trying to type. If deal is closed equals true and this is giving her a conversion, a win rate. I called it win rate and it's computing this at 30% across the whole portal or across the entire table. The win rate is 30%. I only got this because I was able to combine sum a row of function if divided by sum and rollout function of if. Quick pause here. I know I jumped around here because I'm not sure why that QA issue happened and I had to revert to my backup plan. Does everyone make understand how this formula is being constructed? Using a summary function with a row of function, sort of like an Excel sumif a condition and then adding up all the ones and zeros for when this condition is true. Pausing here, kid. Make sure there's no questions.
Seems like most people are understanding it. Okay, one very specific question that I'm actually curious about too. It's for deal is close one you have equals true. I assume that's a boolean. It's not, it's lowercase. But on the other one you have true in all caps in quotes like a string. Is that just a difference in the data structure of is closed versus is closed one?
Yeah, the literal difference here, Kyle, is just that our internal teams have different ways of representing information and we ingest data from them. So that's a little bit weird, honestly. We're trying to fix right now just because basically all these properties were not created with the idea that it would eventually show them to everyone and. And we're a little bit like ahead of them in terms of making this super easy to use for customers and having understand little quirks about is it true versus is it true with caps? And not the best user experience, but just a reflection of us moving a bit ahead of the teams that made these properties. If that makes sense.
Yeah, you're getting some serious head nods in the chat here. I think this is not the first time people have discovered inconsistency in HubSpot standard properties.
Yeah, a little annoying, but the power is still here. So here's a win rate. Let's see. Convert diverging from my talk track. So let's figure out what the best way to structure this is. Okay, so I kind of want to do this and just like actually talk through this and then go into the customer report builder again. I had to diverge a bit because I'm using my backup plan. So win rate is. This is the same as like any conversion rate. We could call this conversion rate but it's basically close. One is true overall close deals. I chained this win rate together with the sales velocity because sales velocity is just a little bit more of an advanced example. The same structure. I'm taking the win rate field I previously computed. I'm taking the deal value. Deal value here I believe is just the sum of deal amount and then the count of opportunities. So this is the distinct count of record IDs. It's taking distinct count of all records in this table. Here it is. Then here is the deal value and then I'm putting this all into the numerator of a sales velocity and putting it over a denominator of the length of the sales cycle. I computed the length of a sales cycle here taking the average of a date diff which is an example we showed in the previous one. Just a row of value datedif day create date and close and then taking the average. When I actually bring this whole data set into the customer report builder to update, save and build, we have the ability to see metrics that previously just weren't possible to see in customer reporting at all in HubSpot. Here's a pivot table. My favorite visualization type. We're going to take sales velocity. Put in the value section. Let's put it next to the win rate. Anything else with here? Let's keep it this way. Let's change the win rate to a percentage to show it slightly nicer format 30%. Then again, because we've built these as flexible measures in the days that builder as opposed to trying to do this using properties, we can freely break these things down by deal owner by type. Basically any of the properties that might exist in your portal or your customer's portal. Here I have velocity by a niche by the type of deal he has and the same for every deal owner in my portal. And it breaks it down really granularly while still giving that report level view of what is the total win rate and what's the total sales lost the entire pipeline. I pause here for questions before I get into a more advanced topic of using the fixed function with these sorts of fields.
Yeah, there are a few questions. I'm trying to organize them because they're all kind of not related but some quick hits of when you're doing a datedif function. How is today Defined it's always like a running today date. Right. Because they're used to calculated properties where you don't have a dynamic today.
Yep. So today is defined by this function which returns the current timestamp in the portal's time zone. So it's basically just like looking up what is the time step of right now it's yearly, a UNIX timestamp. So not like it's like a series of numbers, not an exact date that looks like this. And then it computes that for data sets we recompute this I think twice a day right now or anytime you refresh a report so it would be computed again. Every time a report is viewed again, a page is refreshed, report comes into view. There's a lot of times we just like refresh boards for reports, customers or just twice a day to make sure the data set stays up to date. Any questions, Kit?
I think going to fixed, there's some high level questions about data sets and its overall usage and packaging that I think we can try and get to at the end.
Okay, so last part we have another function called fix and basically fix does. It's similar to trying to like the other things. It's similar to how a fixed function work in tableau. I'm not sure what the DAX equivalent would be for Power bi, a window function in SQL but it allows us to do things like take this win rate and only fix it to one dimension. Don't allow this to be recontextualized and reward view. So that's a lot of jargon. I bet it's easier just to see this through live example. So going back to our data set here, let's take something simple, the sum of the amount. So as we've shown, this is taking the sum of the amount of the entire table and then we go into the customer report builder. This sum deal amount will be broken down by whatever we put into the dimensions of the rows, the columns. But what if we actually didn't want this to change? Maybe we just wanted to understand what is the difference between the sum of deal amount of the table and the sum of deal amount of each deal owner. So imagine I wanted to understand fixed and what this is doing is at the data level it's saying take this number and don't allow it to be broken down by any different dimension add in the report view. So I'm going to call this fixed field amount. At the same time I'm going to add one more field to help understand why this might be valuable. Let's take the sum of deal amount. Let's subtract the fixed amount difference between sum amount and table. Let's go back into the custom board builder review, update, save. Let's remove all these for now and let's just look at the fixed deal amount and a regular deal amount as the values field. So right now these both of you, these both look exactly the same. They're returning that 270 million value. When I add the deal owner here to row section, you'll notice that this measure gets broken down while this stays exactly the same. So it's 270. It never, never changes. And the reason why this might be valuable is you want to understand something like a percent of total or you want to understand this number minus this number and you want to understand that you make sure this number never changes. So difference between sum amount and table here we can see this minus this. I probably should have done it the other way. Plus. But you can always make sure this stays the same and you can understand. Okay, so between Tristan is having about $166,000 less than the total amount we're generating across all deal owners. Not a super instructive example here, but imagine if we made this a fraction. You can understand Tristan is x percent of total and you can make sure you understand the percent of total no matter what thing you you drag into the rows dimension here. So I can break it down by deal owner type, close date or close month and I'll always be understanding like what is the difference between the values in this column Oops. And this column. Quick pause there before I show the sales velocity example. Get any questions in the chat?
None that are outside the bigger overarching questions so far.
I'm going to finish up this conversion rate and try to take those questions after this.
Sorry, just real quick. A couple eagle eyed people have noticed the debug mode toggle at the top of your screen and are wondering what that is. That's I think just an internal tool, isn't it?
Yeah, that's for the engineers. This is like a quality assurance portals or making sure it's purely engineering thing. Yeah, if I open it up it'd be like JSON version example. One sec here. Let's see. Table. Where is table? This is not the right thing to open these up and see which one is right. Difference between table conversion rate is here somewhere. It. It's still backwards. It's taking this minus this. Not helpful. Okay, all right, get. I'm just gonna cut this here and then stop sharing screen Which I do wear. But okay. Those examples I want to show. I love to take the more broader questions now that's helpful.
There was actually one very specific question to that table that just came in. It was what is the simple question you're trying to understand in this report? Table difference doesn't make sense to me.
I can go back here and show. Let's see, window, chrome tab this window again.
Data sources.
Conversion rate for the table. Use something really simple. What's the best simple version here? Give me a second to make a easier to understand example. Deal amount, percentage of total Tristan. Okay, so imagine I want to understand the amount of money that one deal owner has made for me. So Tristan's made X amount of my address and I want to divide it by the amount of money that we've made as a total in our entire pipeline. And that's why I'm calling the table version. So I want to understand Tristan, Anish Sam my portal as a percentage of total where the total is the table or all the money we've made across the entire CRM platform. So some amount, sum of amount minus sum of amount. I want to understand the total. I'm making sure this is always represented as a total and this should actually be a division symbol. So sum amount, percent of total view update, save and build report pivot table some amount, percentage, total Put the dealer here, make this a percentage. So this is slightly more instructive like what we're actually doing here that there's a total amount of money we've made across the CRM and I want to understand what percentage is Tristan responsible for? What percentage is Sam responsible for? Sam has closed 52% of the revenue in this portal. Of the total amount of money I've made, the total amount of money I've raised, we could represent through something like here where I understand same kind of information. So I can see that this number divided by this number is 52%. It just shows different representation of that that it's more easy to read. 52% versus trying to figure out the fly what is 141 divided by 270. Hopefully that's more instructive. Any follow up questions that get.
No, I think we're good. So I have kind of like two groups of questions. One is going to focus on like functionality and then the other one is going to be about just like positioning of all of this. So. So there have been a few questions about these properties and data sets and being used other places around the CRM. So first question is more of a high level is just to confirm data sets are only for reusing and reporting correct not creating properties to live on your CRM. Just wanted to clarify that since there was confusion.
Yeah. So the primary function of datasets is to create reportable fields and tables. The customer report builder we have a beta that allows for us to save a dataset field to a property as long as the data set is single object. That's currently a private beta that you have to request access for. That's why I hedged to make sure that we weren't saying station that that is a primary function of data sets and how we basically market today but it is something that we're exploring and trying to understand the usefulness of.
Yep. And that kind of segues. There's been a few comments about custom workflow features and custom workflow actions. So there was one about so we create custom workflow actions to do cross property comparatives in order to brand processes. Not sure what that would look like but what if dataset level calculations could be set up at the workflow execution level not necessarily to persist or exist upon the record data but for logical processing considerations. So my interpretation of that is a data set is powering this logic that then fires off workflows to take actions and operationalize things. What are your thoughts on that?
My thoughts are that I slacked Sierra last week about that who is the PM of the workflows triggers. So cool. I think that's a cool idea.
Cool. Yeah. Yeah agreed. That's. That's something that's come up quick. So the other like kind of functionality questions it's. It's come up in different ways. People are really wanting to see essentially like a negative association like show me records that aren't associated which is a different type of join. There was also a question that Diana had had shared for someone who couldn't join today. Cameron just wanting to have this person was talking about like multiple objects and that it becomes this like very complex model that they're. That they're building. Are there any plans to build in the possibility of doing more complex joins? Maybe using association labels to add allow users to get more fuller overview of their data.
Yeah. The answer is yes. Kid and I both talk about this a decent amount of what is the best pathway to make the join experience. I hesitate to use specific adjectives because I don't want to say simple because the answer is not simple. It's actually just being more giving people more control over the exact way things are joined. Today we have these pre joined tables that include a bunch of properties that our internal teams have put together which sometimes hits the mark for customers, sometimes doesn't. We have like a five table join limit I believe still being enforced. So like the way we're thinking about that is like yeah, between different join types versus only a left join. A lot of people do outer joins or inner joins of different data sets or data sources. Like that's actually definitely top of the mind for kit. And I like how do we build that across both datasets but also the customer port builder which. And what's the exact way to bring that to life in the customer experience? So a little bit of a lengthy answer just to say that like getting more control over joins is an important topic for us to consider. But the exact pathway and whether it's in data sets. Customer report builder just where. No definitive answers there yet.
Yeah. And just join. Data joins are intimidating. They're hard to understand for someone who's new to data analysis. So it's just a matter of how can we visualize it, make it make sense. Data joins are really important part of what a report has for output. So it's a usability thing as well. And one thing I will say from a association label standpoint, the report builder team, which is my team, is finishing development on support for same object association labels. We do support association labels for different objects, but same objects meaning like company to a company is marked as a parent and a child. So we're actually hoping to finish that work this week and then there'll be a wider public beta that's coming out next week about that. So just stay tuned from that standpoint that there's going to be some level of support for association labels. But as a wider conversation there's a lot to still talk about in terms of joins and all of that. Okay, so I'm going to move on to more of the higher level questions. I'm going to give you an easy one just to quickly shoot off an answer. So are there limits to the number of data sets created?
Our current limit is 50 data sets. There are. Within each data set you can have 40 properties and then an additional 20 derived fields. And we're currently evaluating those limits because honestly we could explode them and we just need to figure out what the right levers to pull. There are, but we would like to. Basically we have almost no one paying those limits yet in terms of like meeting every data set. So we're hesitant to just blow the top off. But if there is someone here that's asking that question. Does they need more? I would love to hear that feedback and like what your use case is.
Yep. So four high level question and then we'll go into the more specific one. Since this is opsub Operations Hub, what would be the best client for this type of service?
The idea like the ideal Persona worth thinking about here is someone who's like really setting up reporting pretty comprehensively for a group of people and like handling the reporting flag flow full out. So they want to have control over what tables are shown to different people. They're thinking about permissions before they even thinking about necessarily the reporting schema. They're wanting to derive properties and make sure the logic for each property or field in a data set. I should say to not confuse things like all the logic is sound and trustworthy and also kind of dealing with some of the difficulties of managing nested formulas and all the complexities that can get into more complex use cases. So we're really thinking about someone that has like a person like that like in your company. Are you going to ask someone to moonlight as our reporting or data analyst or just someone that's really like a true operational administrator or data analyst that can set up trustworthy reporting environments from the whole portal? That's like the ideal person we kind of try to target.
Yeah. So this question is kind of around access and usability of summary functions. James he's actually a customer I had talked with and met with and he's given some good feedback around data sets and customer report builder. I'm curious about one. He's just interested in seeing how can we make summary columns or column calculations more usable from the report and then to just anything to share about the way that we currently have data sets package. There's a lot of excitement around summary functions. Is there anything that you want to talk to and share about that packaging or anything that we can update everyone on? His direct comment was just about wanting it makes sense like the pitch makes sense. But it's a brick to any of the end users to not want to have to pay all that money and to have those fields hidden.
No updates yet. This is one of those moments where my active conversations versus what I should share on a webinar conflict. But I will say that we're pretty aware of how big of a jump in price we're asking customers to navigate to get some functionality that we hope I hope as a PM is really useful to our users and we're trying to figure out what the middle ground is versus having Everything kind of sequestered over here where we might have a customer port builder that is powering available across a much more horizontal landscape. We're trying to make those things fit better together. That is an active priority of my team. But the exact update on how we're bringing that to life, no update right now.
Cool. And there's a question that just came in. Is it planned to make datasets exportable? And then I'll take the second question, which is around ADS performance metrics.
Yeah, we would like to make data sets exportable. I think Harris is going to do that. Kit. No timeline, though. But that is something we're thinking about, that everything should be explorable. We're not trying to hold you hostage. It's just a matter of hearing the feedback loud enough to make a priority. That's really the only reason it hasn't happened yet.
Yep, absolutely. And then the second part of that question. Add performance metrics with other context data. That actually is a data model problem where there isn't yet. There isn't currently an association between ADS data and context data. It's something that we're working with the ADS team on. So the reason that you can't connect that data source with any other data sources in the customer report builder is. Is purely because there is no association. When I say association, you want to think about it as data tables. There is no common shared column that both of those tables have. So without that, there's no way to connect anything. So that's. That's more of just like a data setup thing that we're currently working through.
And one note on that, by the way, is like, that's Google and Facebook. I don't know. Like, that's not. That's how they're giving data to us as, as a ingestor of their data. Less about huge issues in our sighting specifically. So as HubSpot, we're like big enough to actually work with them to try to figure out solutions. But I do want to call out that that's not a problem we autonomously have full control over.
Yeah. And just to answer your question there, Chad, in the ads analyze area, that's all we call it hard coded. It's, you know, it's just we're actually using the version that Google and Facebook and LinkedIn give us for associating the contact, but it's. It's just not usable outside of the ads tool. So there we are able to connect it in that tool, but it's not used from like a data Table having the common column type thing. All right, one last thing. We'll end on this. James had this comment in the very end of Q and A. Would be great to add some preset measures and column options. Kid and Steven like percent of total rather than having to build ourselves. That's been something Stephen has specifically been talking about with his team. So anything to add right there.
Steven1 Templates is a first step into that direction of not just the columns, maybe the entire data set is something that I don't necessarily want everyone to have to build. It's cool if everyone wants to go and get very specific, but as a goal of our team, it's literally to make building useful reports easier and more powerful. And if I can help you skip steps by making templates out of the box, metrics and dimensions out of the box, like those are two levers we're pulling actively right now in our building. Cool.
Well, thank you, Steven and Kit for being here. General consensus in the chat is, Kit, we need you back sometime to go into some more custom report builder stuff. Stephen, someone said you should do four sessions on the OPS hub stuff, so tip of the iceberg, but a very, very productive tip here. And I appreciate you both being here. Kit, your pro moderator. So thanks everyone for being here. We're gonna go ahead and shut this down. Please leave your feedback in the survey on this session so we can continue making this as audible as possible for all of you and hope you all have a great Tuesday.
Cool. Thank you all.
Bye.
Bye, everybody.










