Live CEOing Ep 728: Language Design in the Wolfram Language [Comap, GeoMidpoint and More]
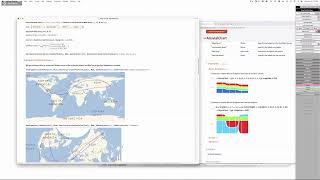
Transcript of a Wolfram Language design review (Live CEOing Ep 728, July 27, 2023) led by Stephen Wolfram discussing proposed functions and naming (COMAP/comap apply), visualization additions (polar/sector histograms, Sankey/alluvial diagrams, Gantt charts, Pareto/Pareto-principle plots, Venn/Euler diagrams), and geographic utilities (GeoDisplacement, GeoIntermediate, GeoMidpoint, GeoTrajectory, Bézier-like constructions on the spheroid). The group critiques examples, argument orders, naming, input shapes, rendering behaviors, and implementation edge cases.
Chapters
Hello, everyone. Welcome to another Wolfram Language Design review. I think we may have skipped a few because of our summer school and other things, but we're back. This is part of our Incremental Language Development series, and I have a feeling comap may be a rather long discussion.
So there are futurized ref pages for the preliminary implementation of COMAP and COMAP apply.
Am I ever going to remember what COMAP does? Headmap.
So there's a section there on naming. I actually looked.
I remember we discussed it at length.
The very first time we talked about it was in 2015. So it's been something that's been circling around for a little bit.
Yeah.
So Ian's collected some notes here on its relationship to category theory, because that was something you had a little bit of a concern about.
And what's the answer? I mean, is there a term. Is there a COMAP concept in category theory?
No.
Okay, good.
This is basically mapping a functional and map maps. A function maps a function.
What about a term like operator map, given that operators are kind of functional?
Yeah, yeah, that could work. Offhand, it's. I mean, unless there's something ruling it out, it does seem better than comap.
I just can't remember what COMAP does.
Well, so here the operator would be the argument, Right? It's a particular kind of functional. It's just evaluating a function at a point.
Why is the argument order this way around?
Because we want to have functions themselves in the. In the first argument.
But this isn't what's happening.
Wait, that first. Yeah, no, that first example doesn't look right.
It seems wrong.
You know, it's reversed. It's reversed.
So this is the wrong way around. So I would hopefully be able to do this and have it work. Yes. Okay. It was the wrong way around. That was really, really, really confusing me. Yeah, I didn't notice that. So what are our other functions that do? You know, we talk about the operator form of things, but what are our names for? We don't really name the operator forms, do we? But that's, again, different. Yet again different. I mean, an operator form for us is something where everything's packed in the head, so to speak.
We have the applied family to do some of those.
Does this have a one argument form?
Yes, it has an operator form.
I don't even understand what this is doing, because this is. Oh, I see. This is taking this thing. This is a really confusing example, if I might say so. I mean, if I were to just see comap of fgh comma X. That's what I want to see.
For a basic example. Yeah. It would pay not to have a list. To not have a list as the second argument.
I mean, that example is just crazy and hopefully the futurized rough page doesn't.
No, it's a good example, Stephen. It's just not.
It's an example of why one would want to use it, but it's not an example explaining what the heck it's doing.
Yeah, I mean, I think that's a great application example.
Yeah.
Basic stats. It's one of the.
Here we go. I mean, this, this the first example here is exactly right. Yeah. I mean, these are not bad.
Can you update your documentation?
Well, this does seem fairly reasonable. I'm beginning to. The comap name, it was, you know, by the time this was two lists and the argument order was wrong, I was pretty confused. But this is making more sense to me.
I'm still thinking though, operator map might.
Be.
More clear to your.
I don't, I, I, I dislike operator map.
Right.
Because in a sense, map is operator map.
Right.
Yeah.
You give an operator in the first an operator form in the first thing and it maps it across the arguments.
Yeah, naming for so long. I think we should put in comap as an experimental function and just see if any of us can remember what it does.
This is a bit like the through function, which I use a lot. Right.
Yeah.
One of the alternate names for it in the past was actually compose through, because if you have through of compose of heads, you get this.
But.
Yeah, except through has not generally been a successful function.
Yes, it is a useful function, but.
Not necessarily not an easy function.
I want to say comap and comap apply together cover the same functionality as through.
I'd probably use comap instead of through if it were available.
Hey, by the way, something is wrong with my docs update and I guess we have to let Roger know this is not working. Let me just send him mail and somebody should ping me, please.
The version of the ref page you had is all right, but I don't think it's.
Yeah, I know, but I'm a little bit worried about what this is doing. God knows it might be, it might be overwriting everything. So let me just, just. Could you just tell somebody, Tell Roger that this is. I've sent him a screenshot of what it's doing. I'm going to kill the process. I'm suspicious there. Okay, so comap and comap apply are going to. Do it.
The experimental functions. That wasn't so Hard, was it?
No.
We got rid of that topic quicker than anybody would have thought.
Yeah.
Can I probably jump to the third section here since we have Michael for somewhat limited time or if you really want to talk about Jira Intermediate.
Well, I mean, it might be easy. Let's take a look.
It's not going to be very easy because there are some interesting extensions.
Okay. All right. Okay.
So this is the selection of chat GPT suggested visualization functions that Brett and I looked at and that he thinks are.
This is a pretty reason. Is Brett here?
Yep.
Yeah, this looks like a pretty reasonable idea.
Yeah. I mean the polar ones for sure.
That's a useful thing to. As a function of. As a function of R and theta. I mean, you can do it, can't you? Buy. What do you actually need to do? You need to do a region. What the heck is that weird branch cutty type thing?
It's probably an artifact of something. I'm not sure.
It's a.
It's a branch from the arc tangent to cut.
Yeah.
Right. Well, that's a good reason to have the function. So it doesn't have stuff like that in it because we've actually figured it out. But I'm going to ask the question. So what would I do in this case. In the case of like a. A Bessel function thing? The whole point is I can give the coordinates. I mean, so. Yeah, it does seem like a reasonable thing to have any. Any objections to this one?
I think it's a very useful one.
Yeah.
I think both of the polar ones are reasonably nice examples.
So I don't know what a polar histogram is. If. Unless it's, you know, why. Why wouldn't this be like a different.
View.
A different layout on of histogram of histogram?
Some of the options would be. Would be different. It would, you know, want the polar frame and polar axes.
But. So how do I specify the polar histogram? So what I've got is a bunch of theta values, basically.
Mm.
And I'm going to make a histogram based on those theta values. But I understand why this thing is. Is puffing outwards as it goes further out. Is that what you would expect? I guess it has no choice. There's just more area around. More perimeter around the circle.
The question of why, why are certain, you know, why. Why are they only 1, 2, 3 different or 4 different.
I assume those are just.
It's a small data set, you know, it has, you know, one, two or three things, I would guess.
Yeah.
I Guess those are real valued. So.
Okay.
Right. But it's still discrete counts on each.
Bit because it's starting otherwise. In other respects it looks like a pie chart.
This one is implemented using, you know, a variant on pie chart.
Okay, all right.
The whole point is that you're being thrown a bunch of theta values. You're not being thrown a. I mean, in a bar chart you're being told his. Or a sector chart, you're being told. Or pie chart, rather, you're being told. Here are the. Here are the widths of the pie element.
Yeah, the line.
Well, this is a completely different thing. Okay, this does seem reasonable. This is a bizarre use of. Of AIs. What a strange use.
I think it's going to be difficult to see zero values.
That's a good point.
So I wonder whether this should start with some fixed radius.
Well, maybe that's an option.
I mean, it's certainly possible to do something like that.
Well, negative values. Your toast.
It's a histogram. You can't have negative values.
Well, good point. But wait a minute. Zero values then are likewise just gaps like this, right?
Yes, but is it possible to appreciate there. How many are jumping or skipping?
Well, there's none.
There would be if you had radial. If you had radial lines there for every. I mean, you could imagine having something where every bin. I mean, I don't understand why these bins are of different widths. That doesn't make a lot of sense to me. See what I'm saying? I would expect that the thing would have every 10 degrees. There'd be all the thetas in those 10 degrees.
Yeah, perhaps that's the problem. Perhaps we need some intermediate lines between.
Right, but also.
No, no, no.
I mean.
Right, what Stephen's saying is that all those sectors should have the same central angle.
Exactly right. At which point you can kind of see there's a gap of that size. Just like you could see on a standard histogram. You could see, oh, there's this region of the X axis that has nothing in it. I think that will solve itself. I mean, there's a separate issue which we don't tend to need to have an ordinary histogram. And I doubt we'll need here, which is kind of separated lines between the positions of the different bars. You don't need that. And I bet you won't need it here. This is just a bad example, right?
Yeah. The reference examples are maybe easier to look at. This was just something I happened to have that was doing effectively a polar.
Histogram.
I can't really tell completely, but I mean, those. We know what this is supposed to look like.
Yes, but you saw that the third one had a.
I mean, the third one's nuts.
But, but, but it starts with a. With a fixed non.0 radius. I think if. If you are interested in these green, very small.
I see. Sets. I see, I see. Because your point is that by the time you're down here, these things are very tiny.
Exactly.
Yeah, yeah. So probably we want something called, I don't know, origin, radius or some such.
Other thing we already have. Sector origin.
What does that mean?
It does pretty much exactly what Jose is describing.
Okay, you know what? Can you see the fact that that silly raft is running away from me again? I keep on objecting to the same thing. Can we make sure this is covered in the user assistance meeting?
Okay, yeah, we'll make sure Carla passes that along.
Oh, wow, look. Those are old colors.
What?
Oh, yeah, that's a old styling.
That's the original V7 color scheme for sector chart and pie chart.
So you mean if I run this again, it'll be different? Is it better now? Oh, anyway. Okay. But this is the sector origin.
Yeah, I think this is exactly what I was.
Yes, that's exactly what's needed.
Yep.
Okay. Should this be called polar histogram or sector histogram? Probably polar histogram is, I think, polar. Fine, let's go with the. Go with the bot.
Otherwise we're back here in six months.
Where, yeah, the bot has just made this up 25 million more times. Okay, Sankey diagrams. Yeah, yeah, yeah. People ask for this with some regularity.
We actually have the cousin alluvial diagram in the wfr.
What exactly is this? I'm unfamiliar with this, with this name.
So. So this is showing flow from, you know, between different states by volume. You know, so like your left hand, you know, the trendy use for these is, you know, you're. You on your left, you have, like, your income and you have your job and you have, you know, your parents are giving you an allowance or inheritance or something. And then you sort of show what your income is and where it goes in your expenses and what you're paying for rent and food and your investments and car insurance.
And it's a graph for your purposes. It's a graph. But it's a graph which has.
It's a very weighted graph.
Right.
And I guess.
Yeah, bipartite. Yes, exactly. Directed in bipartite.
Not necessarily bipartite. It could be the way it's laid out.
It is. But yes, you're. You're correct because you could have the same names on the. On either vertical.
Well, no, what I mean is that you'll sometimes see multiple vertical things that you go from this to that to the other thing.
Okay, so yeah, sequence.
It'S a bunch of countries, and for each country it's a bunch of items.
But you could, you could actually consider countries to items to countries in terms of import, export.
Kind of fun. I didn't know this was. Since I've just been writing about this, the history of the second order of thermodynamics. It. Huh. So there's interesting.
I think there's a triangle in the top left.
Right.
You've got three vertices forming a triangle.
This is a little different than this. I mean, this is. This is being.
You still have the property of, you know, conservation of weight going in and weight going out.
Yes. Okay, so let's just talk about. Okay. We also need to understand this alluvial diagram thing. What is this now? What does this mean? What is this? This is. I see. This is stages. What is this exactly?
I don't remember what this is doing.
Well, okay, let's look at this one. First of all. Okay, so what is the proposal here? Is the proposal to use weighted edges or something? I mean, if I run this, okay. And I just say, I don't quite understand, could I just make a random graph here?
I mean, I don't think an arbitrary random graph would work. At least probably not for that code.
What. By the way, could somebody report again yet again, these stupid messages are going here. This is some bug with docu tools. Make. Make. Who's PMING here? Me.
I. I'll be checking.
Checking that.
Yeah, that's. I mean, it's being actively investigated.
Okay, all right, fine. Okay, so this. We want to say something like rule triple at this. And then we want to live incredibly dangerously and say thank you. Diagram of that.
Huh.
Is that not a work of art?
It is. It's lovely and even useful. Wow.
I think the main thing this is missing is the, as you were saying, the weights or the widths of the.
The links.
Right.
But in this particular case, so. So the thing we'd want to do is one is sort of histogramology of having. I don't know whether we want to. We want to be able to decide whether we merge two things. If we have one goes to three and we have two items of that, so to speak. See what I'm saying? We might want to merge them either visibly or invisibly, but otherwise these things here. I would have thought that we should support three syntaxes. You know, arrows, edges, direct or undirected edges. And. And also, you know, something like. Because, you know, we've got directed edge of 1.3.5, for example, which is a weighted directed edge. And that will be a really nice thing to be able to have is take is get this diagram from a graph. But then we should also support the form 1.4.5 just like that. I think.
So that's, you know, two from. I mean, from two and weight.
So. Yes, both multi graphs and weighted graphs.
Yes. What happens if I just do this? I don't know. I've never tried this.
It will probably treat 1. 4 as a vertex. Oh, no.
Well, yes, it did.
Yes.
Oh no, no.
It treated it as an edge.
Okay, so now if I do this with 0.6, 0.2, I think that should work. I don't see any reason why that shouldn't work. That's something for Charles and friends.
Okay, yeah, we'll pass that along.
Do you agree that should work? I mean, it seems useful to me.
Well, I mean, graph, you know, it's a statement that, you know, vertices can be anything. Right?
Yeah, but this is not. This is not treating vertices as anything here.
It's really more edges.
Yeah, well, I mean. Right. I mean, the question is, which way should it work? You know, should that be weights or should that be.
No, no, this is the correct thing. This is the correct thing. There's nothing else. This could be. There's an alchemist here. What's that?
Edge weights.
Yeah, there's got to be edge weights.
Does undirected edge take the. The three argument form?
Yes, yes.
Yeah. I mean, this should be equivalent, this thing here. Just like this thing here. Is undirected edge of two arguments equivalent to that. This should be equivalent to the three argument form. It's just an oversight.
What is a. For the purposes of Sankey diagram how to handle negative weights.
For the purposes of. Of a graph, how do we handle negative weights? I think we just put a. Maybe we have a dotted line.
That's what I was thinking actually in the. Run it in the middle and use the width for weights.
Perhaps.
Perhaps dot the whole thing if we wanted to. I mean, that's a style. At least.
The height of the bars on the sides will be tricky with negative weights.
Right.
The one and the two left overlap somehow.
Oh, yeah. Well, I, you know, I don't think negative weights are the biggest priority.
It's an edge case We.
Yeah, okay. Kick him from the meaning.
So we. We could actually just have those heights equal to, you know, related to the number of edges.
No, you. Right. It should be.
Why?
I mean, the height should correspond to the total.
Why isn't this symmetrical?
What did you do? Sorry.
Complete the complete graph on five edges.
I think it's not right. I think it's a bug. But anyway, it's not a big deal.
What is edge list for that complete graph? I mean, I'm guessing it has like.
One, two, but not two, one look. Absolutely magnificent. But. Oh, oh, oh, I see what the problem is. The problem is it is this edge list because they're undirected edges, right?
Yeah. They're ordered, Right?
Yeah. Yeah. So in fact, the correct thing to do here would be to say, you know, join hash and reverse of hash.
Or you could just say directed graph. Directed graph goes to true. Right.
I'm still confused.
Perhaps the symmetry is left to right. You see how the sizes are decreasing on the left and increasing on the right.
Yes.
There is some sort of combined symmetry. Up, down, left, right.
The main point is these are very.
No, you didn't reverse the right.
You.
You reversed the whole list. You didn't reverse the individual elements.
Silly me. That's better.
Yes. That looks.
That's lovely. These are really nice. I mean, about the black on the right. I don't understand that. Why isn't the.
It's just a default color scheme is if you go up and change the definition, you can.
Why not. Why not use that same coloring? I don't understand why the coloring of. Of why the. Why this isn't one coloring over here, if you understand what I'm saying.
This is a simple prototype. It's not.
Yeah, okay, fine. Right.
And certainly in the general case. Right. The left and right things will be completely different. So it's not clear that it means.
You don't want to use the same colors on the right. It gets very confusing because the rece. It's the receiving end of multiple colors, each of those blocks.
Right. Also, another point is that I think in many cases you may want to. I'm not sure you want to rotate the 1, 2, 3 fours to be reading this way around, if you get what I'm saying.
We want the same orientation.
Maybe, maybe. These are lovely, though. These are great diagrams. We should absolutely have these. And I even like the color scheme.
Okay.
Awesome.
They have this resemblance to a lot of code I have looked at over the years. Some of it. Some of it my own.
Well, I mean, this is relevant. The name Sankey diagram is a bit obscure, although it is what they're usually called. But it's going to be relevant to like string diagrams and tensor manipulation and so on. Don't you think, Jose? And others.
Perhaps?
Yes.
Because this is showing like if you're, you know, take two sensors. This is a good start.
I was gonna say. I've certainly seen like diffuse between files where, you know, one line got, you know, turned into three and so you have a little widening, you know, spline type thing connecting them.
Right. I think this is great. And I think the fact that we can take a graph, I mean, by the way, the Sankey diagram should be able to take a graph as input.
I wonder, Brett, what you said, I wonder if that's actually better suited for an alluvial chart, that kind of diff.
Yeah, maybe.
What is an alluvial chart? Well, seems to be it has these weights changing over time. But what is the graph version of it? Subcategory of a Sankey diagram.
It's one of those things where I think I've seen different Definitions for Sankey vs. Alluvial and you know, not consistent.
That sounds right.
I see. So this one is something where it is like a multi step Sankey diagram. This is a one step where it's just going once across. And here it looks to me like it's going well.
Yeah, except it's not. It's not exactly showing the receivers. It's sort of, they're not spreading every which way.
If you do an image search, there are lots of examples of multi level Sankey diagrams.
What does that mean? What I'm about to find out.
Where you have multiple vertical states or multiple columns of states.
I see. Like this.
Yes.
I see. So that's going to be a graph. So we're going to have a list of graphs. Basically, each one of these regions is a graph. Or this is a collection of edges. This, this is a collection of edges. This is another collection of edges.
It's an end partite graph, right?
Yeah, it's a cascade of.
Yeah, we should have had these diagrams a long time ago. And by the way, this form of labeling where you're just going into the graph is also a thing we should have. These are nice graphs. We should have had them a long time ago, as I just said. Okay, well, that's the thing. So I mean, there's probably a little bit of work to be done, Brett, on you know, inventorying all these different types, but this is clearly, you know, Good work to the AI. Hats off to the bot. All right, let's look at Gant chart. Yeah. These are surely worth us having because they are common things.
I guess the question is what does the data look like for them? I mean, because the one in the function repositories.
Right. It's very esoteric. That's why we had them put the project data in the name. We weren't going to allow them to name it Gantt Chart when the input was this bizarre data set.
Right, right.
I mean, if you look at the reference examples, you know, your typical Gantt Chart, there's a very clear progression over time.
Well, depends on the project you're doing. I mean, they're usually with respect to time.
I mean, the respect to time. But you also did things where, like this stage is a precursor to that stage sort of thing.
I don't know whether that's true. I. I thought that they just had. They were just like indicating when different things were happening.
I mean, and maybe that's the case and maybe that, that makes it a simpler design, but it was just a list of data intervals or something.
Yeah, I think that's what it is. Right.
Yeah, I think it could be a list of lists of intervals, optionally, if you want to sort of.
Right.
Depends.
And you have multiple parts of a project and.
Right.
And then it should support labels as rules, probably.
I think so. I think this is the basic thing. I think it should also. I mean, it should support values that aren't dates, although those intervals or data.
Intervals, but not mixed.
Sure.
But it should also support pairs of numbers, probably to just be coordinates, I think.
Sure.
All right, I agree with the bot again. All right. What's this?
I don't think we need printer. Well, I mean, who knows? I mean, the bot suggested it, so. But yeah, we've had a version in a package for a long time.
No, pretto principle.
You're. You're plotting the outer hull, so to speak.
No, that's a different thing. That's. No, no, no, no, no, no, no. I mean, Pareto principle plot is completely different from Pareto plot.
Okay, what is Pareto plot is Pareto plot.
It's a bar chart with an accumulated line plot.
I don't think we can.
I don't think so either.
I mean, that will be a fine wfr, but. And I think poor Pareto would be horrified by what people have attributed to his name. Okay. Venn diagrams. These are things that come up with considerable frequency and seems to.
This is by far the most often one that GDP Makes up by far most interesting.
It just takes a list of sets and.
Correct sets.
Yeah.
Not what we're doing here. What we're doing here is symbolic.
I. I don't understand what.
It is.
Oh, so it's gonna. So it won't be the circles. It'll be.
I mean, it'll be circles for one or two things. I mean, two or three things and then all this weird stuff.
Right. So I. I don't understand what the inputs and outputs are. When you talk, start talking about finite sets. I mean, right.
It should be union and intersection. I would have thought I would assume.
What it would be is that it.
Gives the sets A, B, C, D, and the sets are a list of elements.
Right, but then what is it showing?
Yeah, it's like. It's just like a characteristic function.
Right?
The things that are included.
Who.
Who intersects with whom?
Well, okay, Michael, that's still.
I mean, I know what a Venn diagram is, but. A Venn diagram is just a representation of, of the possible inclusions and exclusions. It is not data dependent.
Well, this is an example there.
But those are unions and intersections.
Again, the shape depends on.
It depends on what?
Like assume you have three circles. Then there are multiple possible Venn diagrams. The three circuits can be distinct. Two of them can be overlapped, the third can be. One can overlap this one. The third one is only with one other one, and all three overlap. There are plenty of possibilities.
Well, this looks like a more of a more reasonable picture. This is the ones where this is showing the elements in the set, you know, this is showing the elements that are only in this set. This is showing the elements common to those two sets, et cetera.
But this is at typical because every intersection is non empty. That's not the typical case.
Okay, fine, but so, but that's the. That's the ultimate way one would draw it. If one has three.
I mean, there's nothing to prevent, you know. Right. That if that C were moved.
Exactly.
Yeah.
You'd have an empty intersection. And you can still depict it this way. It's clear enough, I think.
This is not what people want.
What do they want? How do they want it? How do they want to show the.
Empty sets if it's empty?
They don't want the intersection to be shown with the finite area.
How do you do that, though?
You can't.
Of course you can. You just cannot use circuits anymore.
Right. Well, okay, fine.
What shapes can you use? Do we have. Does our Venn diagram function? Deal with that.
You'll notice that Everyone there pretty much seems to be a circle on this.
One approach is to just show. I like this approach here. This seems like a good thing to do. You know, you could imagine flags here. You can imagine all kinds of things.
Well, okay, I think the part of the issue is that we have two different uses for Venn diagram. One is, you know, a Venn diagram of some symbolic logical operation. You know, a union, B intersects C. Yeah.
Whether. Whether. Whether.
Which is what's in the notebook.
Yeah, I know, but I think that's a minority case. That symbolic Venn diagram is not what people are usually thinking of.
Right.
And then the other cases where you have sets of concrete elements, you know, you. You have like three. Three lists, each of them containing some subset of, you know, countries. And you want to know which countries are in, you know, you know, which, you know, shared between, you know.
You.
Know, split by type of government or religion or something.
Right. But actually, we can combine these two ideas because you can label, you know, in this case here, we're probably labeling, you know, Russian Alphabet, Russian, Greek, Roman, Latin Alphabet. Right. And so those three things can have labels just like these have labels. A, B, C. Yep. So really, it's the same thing. So what we've got here are.
You.
Know, we've got a collection of. Okay, here's what I claim. One thing we might have is just a, you know, Venn diagram of a collection of sets. Is this making sense? Hold on, let me think here. Yes, that's right. It's a collection of sets A, B, C, you know, C, D, I, D, I, JJ or something. Dijk. Whatever it is.
Right, right.
That's three sets. And that would be a ternary Venn diagram, so to speak, with three circles. And we would show where things overlap. Now. Now, presumably, just like we do for other things, we can say, you know, you know, X goes to this and so on to name these things.
Right.
Was it that thing goes to X.
Probably that thing goes to X. Or you have.
Sorry, what a second. That thing goes to X. Right. Or an association. You're right.
I mean, chat. We're getting these from CHAT GPT. I mean, do we know what. What people have been asking ChatGPT for what kind of inputs?
Yeah, yeah, yeah. This is what they. This is what they want.
Basically, exactly what Stephen put in the first line. Sets, sets of elements.
Okay. So that's the case.
Everything I put in could support the thing on the first line as well.
Right.
I'm regretting using strings for the keys already, but, yeah, this should Just be.
Symbols as long as you're not calling two expressions on them.
You're what happens when you're typing a chat instead of typing in a notebook.
Is this work? This doesn't work, does it?
No, no, no, no. This is what I'm proposing for a design. The second argument says what the highlighting is basically.
And I see.
And then an option whether to do what Michael is suggesting where it's non circles if needed.
And I think they're technically called Euler diagrams.
Nobody knows that.
Actually there are quite a few wiki hits if you look at images.
And the first, if you just want the pure logical thing, the first argument could be empty list or an empty association and it would work.
And I don't think that the logic thing is the common case. I think the common case is.
Right.
I mean the most common case.
Right.
Where it's just data, just sets, there's no labels. That's the most common use case. And it would.
Yeah, yeah.
I mean there's. There's only a, you know, handful of, you know, like what, eight or whatever logical operators we can detect the head.
Yes, for that, that's okay. But I mean, you're suggesting that I should look up Euler diagram.
Yep.
Happens when you get to more than five things. I mean how. How far are we gonna go?
Can.
You're out of luck.
I think up to know what.
Okay.
I think the papers would do it up to 12.
Up to 12 Venn diagrams.
Yeah.
Don't you hit the four color limit a little bit sooner than that, like at 5.
So anyway, Stanwagon actually has, you know, a paper about Venn diagrams.
Yeah.
And I forget what the condition is. There's a condition on. Under what? That under which circumstances you can have a Venn diagram which uses the same shape for all the regions and it goes way more than 12, but the shapes get really weird.
But.
Right, but I mean more than three, it can't just be circles.
I understand, but so, so okay, so we will need some. I mean the question is do we have a different head from Venn diagram and Venn diagram. I mean Venn diagram for more than three can't be circles anyway. So the only question is whether we do what Bob was suggesting and you know, just have an option for whether to distort it to avoid empty sets. Michael, does that make sense to you?
Yeah.
I think we've got a very nice function here. These are good. These are good suggestions. I mean, my gosh, these are better than we've had from. I mean you know, it's like that the bots take over because this is. These are, these are good ideas.
I mean, they do a lot of code writing every day.
Well, and they also read a lot of stuff people have written, so. Okay, let's get these as soon as we can. These seem like high priority things.
Okay, just a second. I'm going to send you a link. Stan's page is out of date, so it's a second. Can I share for a moment?
Okay, well, yeah, no, it's better if you send it to me.
Well, it's an image search that came up in. The image isn't on the page, so I'll send you a screenshot.
Okay. Come on.
Okay, I sent it.
And what form? Email or something else?
Yeah, email.
Okay.
The AMS article has some beautiful pictures.
That may be the one. Maybe.
What I probably.
So that's. What the heck is that?
That's a Venn diagram like probably 30 or 40 sets.
Well, it's what Stan with his early life in Barnach Tuskegee Paradox land.
Yeah, I was thinking that, you know.
I mean, so it's, you know, some weird shape that, you know, is able to intersect itself in a way so that you have all two to the n. Sure. Combinations.
So you're saying it really is circles? Only they've been, you know, split into a finite number of parts and rearranged topologically.
It's a circle.
Yeah. Okay. This is Barnard Tasky land. That's very cool and certainly something we can make some use of. Okay, great. Let's go to our last item here. These were, these were really good. Okay, let's look at GEO intermediate, whatever that is.
Don't. Don't you think Chat GPT deserves a raise for that?
Already pretty expensive, but in the media.
It's also from Chat gdp.
Yes.
So it started with GEO midpoint.
Oh dear.
And we decided to add an argument so that it would do interpolation from 0 to 1. And so I'm proposing that before we do that, we do a little extension to geodisplacement so that we can multiply it by numbers. And this is implemented in the X column.
Multiply the displacement by numbers.
Yes. So displacements cannot be added. So there's not a full algebra of additions of geodisplacements because they depend on where you start.
I understand.
But you can multiply them by numbers so that the number would not change the direction for positive multiplications. They would change the distance you traverse. And if it's a negative number, then they.
Yeah, I see. I mean, there is a vector addition where you could say, transport the base of this displacement to somewhere else, isn't there?
Well, the base is not in the displacement. The displacement only knows how much to traverse and in which direction. Then we have geodestation to give a. An initial point.
But there's a special point right there. I mean. Or you're saying this is then disembodied. This is merely the displacement vector.
Exactly. It computes the displacement from here to London, but the result doesn't have neither the position of here or the position of London.
I see. Okay.
And now with geodestination, we could say geodestination of here and that geodisplacement and we would get back London.
Right. So an easy way, it would give us the midpoint along that line.
Exactly.
Yeah.
So now there is this function geo intermediate, which would be your midpoint with t equals 0.5.
We have that now.
No, in the X kernel, if you evaluate that definition, then it works.
Okay. Okay, but what are you proposing? You're proposing?
I'm proposing that we extend geodisplacement to be multipliable by numbers. And then it's very easy to create.
But do we need the function geointermediate?
I think so, for what comes next.
So what are those numbers? Are those like a distance and angle with respect to a line of latitude or.
Sorry, sorry, no. Your displacement takes a distance in meters and an angle in degrees from north.
From north.
Okay.
Yep.
That's a convention in geography.
So, by the way, when we do the spherical analogs of this, we may. We probably need some spherical analog of this where that's distance on the unit sphere and that's in radians and so on.
Right, yeah. So can you evaluate the geointermediate definition so that we can play then, particularly.
If I go to move this to the X kernel? Yes.
Oh, oh, oh. So the. Sorry, I thought this was the X kernel.
Okay then, but I didn't do that correctly. Okay.
So the idea is, you suggested in the last meeting, and this is where we left it, that we look at the Bessier constructions. And so what I'm proposing here is that we can extend this construction to Bessier curves on the sphere on the spheroid, actually.
Oh my gosh. What did I suggest before?
Yes, so that we look at Bessier constructions. Bessier. So we were looking at how to. What would be the right function, the right construction, and with the shear curves we can get intermediate points by providing a t value. So I'm trying to imitate that. And so the interesting idea is that there is this second definition, GEO intermediate of a list of points, and you see, it's recursive. So we do GEO intermediate of most, GEO intermediate of rest, and then another GEO intermediate with the result of those two. So this is the basic definition for Bessier. Actually, I think it was found by somebody else. De Castel Diou. Another French.
Let me see if I can't evaluate this. What version am I running here?
Oh, but this is strictly with respect to arc length on the geod.
Yes, exactly.
So is this going to. What the heck?
What do you do if the GEO positions have different heights?
So, yeah, so that is a way of getting the point at fraction T. Yes, I see. So now the thing is, if we had three points instead of two points, then we could do some sort of bezier construction. And you see, it starts at the first one, it ends at the second one, but it's doing some sort of quadratic interpolation in that case, because it.
Isn'T that second one. It didn't hit the second one.
It didn't. It's just the last one. So I'm counting zero, one, two. So the first and the third, I should have said.
Yes.
So this is the basic. If this was a Bessier curve, I.
Think this will confuse people.
Why?
I think people would expect this was along the path.
Yeah. Why don't we want it to go along the path?
I'm just trying to imitate what Bessier curves do. I mean, Bessier curves do not go through that intermediate point.
Why did we have a.
Okay, because Bessier curves don't go through points.
No, no, I know that. I know that.
They go to the first and the last.
Yeah, right. But why do we want that for these GEO intermediates? I don't understand that.
So the GeoIntermediate function takes two points in the. In the. In the first argument.
Right.
And so the discussion last time was, what happens if we have more points in the first argument? And that's why we said, okay, let's look at this year. And so what. What I'm saying here is that I found this way of generalizing Bessier from the plane to the. To the ellipsoid. And it has the same.
I think that's magnificent. But I think, as Michael says, it's utterly confusing to people.
Okay, okay, we can keep it with two points.
Yeah, well, either that or go along the paths.
But to go along the path would be what the Black curve is doing. Just geodesics from one to another. And so there are the fact that it's not smooth at the intermediate point.
I don't know why you want it to be smooth. Why would you want it to be smooth?
If this curve had many points and the points were relatively close to each other, then this would be a construction that gets close to all the points and smooth at all the points.
Well, I mean, I could imagine that we have some kind of interpolation order, ish type thing or geointermediate.
So can you go to the last section or. Yes. So here you see, for example, the two situations we have. So we have. There are four points in the black curve. Then we have. In red we have this new construction of a bezier curve. And then in blue we have what would be the bezier curve. In flat computations with geopositions, if we change the projection, then the red curve doesn't change. So you see, it still goes through Cuba, through England, through Finland, but the blue curve is very different.
What is the red curve?
Mathematically, it's the Bessier curve computed on the.
It's the image of the bezier curve in the coordinate space. In real space.
Yeah. Right. So it's a three dimensional bezier curve now projected onto the geo, now projected with the projection that's used for the. For the geoprojection.
Not really, because it's always on the sphere.
It's always on the Sphere. There's nothing 3D here. It's a computation purely done on the spheroid, but changing from the Euclidean geometry to the spheroidal geometry.
Okay, okay, good. But is that equivalent to doing the Bezier Construction in 3D?
No, no, no, it's doing in the. In the flat coordinates.
Right.
It's basically, there is nothing flat in that computation. There is this recursion which is the basis of the bezier construction. And I'm just changing the recursion to be done on this ferroid.
But didn't you say that the first one is doing it?
The blue curve contains flat computations on the projected space. That's why it's not geometric. You see how much it changes from one projection to the other.
Right? Oh, I see. I'm sorry, I was confused. Which curve we were talking about.
Right.
So the blue one is the one that uses flat computation, the standard ones, and that we always had by just using bezier with your position points. But what I'm trying to say is that the blue curve never went through the points themselves. It never went through Buenos Aires. But it wasn't geometric. It wasn't a properly computed uniquely defined curve that is well defined for all projections. And the red curve is. This is just a generalization I found while trying to design these GEO intermediate points. So if it's too, too complicated, we just don't, don't use it to the.
Two point case for now. Although, I mean, look, look, here's a very standard situation, which it isn't really. I mean what we're really going to want is a plane is flying from waypoint to waypoint on GD6. Let's say the plane is flying from this point to that point.
Yep.
I guess we assume they're GD6. It might not be GEOD6, but. But let's assume that. And then at each waypoint it knows it got there at 1:23pm or something.
Yep.
So it's going to wind up being a time series, you know, a GEO intermediate time series.
I think that something is. This one is a pure geometry without time.
Okay, but why does it have a T parameter?
Because it's a distance.
It's a fraction.
Yes.
Fraction is sigma rather than t. Yeah.
Yes, this is.
Yeah, you're making the point. Go ahead.
Yeah, it's traditionally called T, sometimes S, but it's basically the fraction between one point and the other.
Yeah. Independent day how long it took you to get there.
Right, right. Fair enough. Okay. And then there's a separate geotime series.
Yes. We were planning a geotrajectory that would take dates and know what to do.
I mean, could we split the difference between the very confusing multi point geointermediate and bezier by somehow sticking bezier curve into the second argument of GEO intermediate.
Or I guess I have to run off here. Unfortunately, as you predicted, this, this topic is not quite as simple as we expected. Maybe we should talk about this again in connection also with GEO trajectory, which is going to have similar relate, you know, issues.
Okay.
All right, I should run. Thanks a lot guys. See you all soon.
Okay.
Wow.
More from Guy


Cheryl Strauss Einhorn | The Human Edge: Smarter Decisions in the Age of AI | Talks at Google



Rachel Glennerster | Innovation and the Center for Global Development | Talks at Google

Rebecca Winthrop | Rethinking the Purpose of Education in the Age of AI | Talks at Google

Dr. Robert Wachter | A Giant Leap: How AI Is Transforming Healthcare... | Talks at Google



