Studying the Decomposition of Radioactive Material from Supernovae
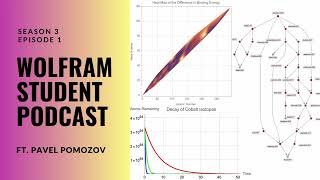
This content was created by Guy Kawasaki. This content was uploaded by Guy Kawasaki. This is a YouTube video titled "Studying the Decomposition of Radioactive Material from Supernovae" featuring an episode of the Wolfram Student Podcast. The episode, created on September 11, 2024, is hosted by Tianni Gu and features guest Pavlo Palmazov, a high school sophomore, discussing his project on the decomposition of radioactive material from supernovae using the Wolfram language. The conversation covers Pavlo's research process, findings, and future project ideas.
Chapters
Hello, everyone, and welcome to season three, episode one of the Wolfram Student Podcast. I'm Tiani and I'm your host. This is the Wolfram Student Podcast, where every month we dive into a new innovative project done by high schoolers or undergraduates using the Wolfram language. For this episode, let's welcome Pavel, who will be discussing his project on the decomposition of radioactive material from supernovae. Hi, Pavel.
Hello.
All right, so could you give a quick introduction just where you're from, where you go to school, what grade you're in?
Of course. So, hello, my name is Pavlo Palmazov and I'm a sophomore attending Valley Christian High School. I live in San Jose in the Bay Area in California. Last summer, I intend, I attended the Wolfram Summer Research Program and created a project like about chemistry and astrophysics. And this was my first year coding in the Wolfram language.
All right, perfect. Thank you. And just a classic question that we like to ask everyone when they come up onto the podcast. What is your favorite Wolfram language function?
Hmm, probably a common one. The function that I used a lot in my project was isotope data. This function is used to get data of an isotope. And you could also choose what data you want, like atomic mass, atomic number, binding energy, and so on and so forth. And yeah, I guess I use it a lot, so I'd like to the most.
Yeah, I think it's really interesting. Some people pick functions that are really essential to their project, like you did, and others pick really, really general functions. So that's something that's really interesting. All right, fantastic. So if you could just give us a brief overview and kind of a summary of what you did in your project and what it is about.
Yeah. So for my project, I studied the decomposition of radioactive material. Through research, I was able to determine some isotopes that were formed as a result of supernovae. From there, I did all sorts of things with this information. Some examples are graphing the amount of isotopes released and graphing isotope data as a result of time. And I'll go through this and explain all these later on.
Fantastic. And just for people who might not have as much background information, could you explain what an isotope and what a supernova is?
Yeah, So a supernova is like a collision of stars. And what happens when this collision happens is that it creates like a big blast, a big explosion. And from there a lot of heavy elements are formed, like I did. Iron, uranium, uranium, nickel, cobalt. All of those are some isotopes that are expelled. And with these elements, I mean, Most of our planets are formed, and, yeah, I guess that's what happens.
Fantastic. Let's get into it.
All right. So at the start of my project, I just gave a quick summary on important information. You know, for example, supernovae. Supernova is just an explosion of stars, like I mentioned before. And basically my project is about that. I also talked about the half life, which is the amount of time it takes for an isotope to decay and how long it lasts. And then I talked about decays, which is like the time it takes for something to decay. And there's two different types of decays. I focused on the beta decay, which is when the nucleus loses a proton or gains a proton. And then I also talked about gamma decay, which is where no change happened in the protons. So, like, basically the atom becomes a different element. And then from here, I graphed and analyzed iron. So in order to find, like, the percentage of how. How much iron is released from a supernova, I did research and also mentioned, like, the websites I use and the information where I got it from down below. So basically I just found numbers and put them in a pie chart. My code, like I said, just takes information and graphs it in a pie chart with also labels. This is just this part right here.
So quickly, I noticed in the table above where you use isotope data, which is actually the function you mentioned for some of the half lives, they're infinity. Can you maybe explain what that might mean?
So I'll talk about what a half life is. A half life, like I said before, is the time it takes for an isotope to decay into another isotope. And if it's infinite, it's not actually infinity. It's just like a really, really long time. That many people just say infinite because, well, it's billions and billions of years. And it's basically impossible for us to, like, track. Like, you know what I mean?
Yeah. So we can consider them as being, like, stable. Pretty much, yeah.
Stable, yeah, for sure. Thank you. Yeah. And so for the next part of my project, I just made three graphs. I plotted the decay rates of different elements. At the start, I defined the half life, which I got, like, from researching. And then I was able to write it as variables. And I use a logarithmic function to graph all these elements. And so you can see this line right here. It means that the half life is a very long time or infinite. So if you look at a graph, it's like, it goes all the way. It goes like a slope, you see, or like a curve. This is straight because it's like a really long time. It doesn't really change. You know what I mean? Yeah. So I basically did this for all three elements for cobalt, iron, and nickel.
And just quickly, why did you choose these three elements? Are they ones that are commonly found in these supernova? Yeah.
So while researching, I searched up elements coming from supernova, and I found just these three elements. And actually, I believe that iron decays into cobalt and cobalt decays into nickel or something like that. I'm not quite sure. I forgot. But yeah, it's something like that. And also added labels and stuff for all these three graphs so you could better visualize it. All right, the next part, I graphed and analyzed uranium. So for this part of the project, I created a chain plot which was made using by highlight, the highlight graph function. This graph takes in an entity and returns like a flattened list of its nuclei. And what this means is, you see, you know, how uranium 235 decays into other materials. And basically just a graph showing that if I change the slider, you get your be. You could see, like, what highlights and when it changes into. So this is a time. This is a slider in the time function. So if I slide it, it'll turn red.
I see. That's really cool.
And you could also see that some dots are like blue and are not red. And this is because their half life is infinity or stable, as you might say.
So if it's, if it's blue, does it mean that it decays down to that one, or is that like the one that it doesn't reach?
So you know, it decays into it, but it's blue? When it says it's red, that means it's fully decayed. It's not there anymore. It's just stable. It's still there. Okay. And I know you asked the question before on why I chose iron. I'll explain why I chose uranium. I feel like an application. I feel like uranium just has a lot of applications and nuclear physics, and I have a strong interest in nuclear physics. So I, I just decided to choose uranium because it was also common in supernova.
Yes, for sure. I, I think I've definitely heard that as well about uranium. So it's a choice that makes a.
Lot of sense, then onto the next one. So this part was more challenging for me. This took up, like, maybe like a little more than half my time at the, at the summer camp. So here is binding energy. So in Wolfram, there's a Wolfram database which has a lot of information and a Lot of data about multiple stuff. And there's also a formula, the Bethel Wysocker formula. It's used to calculate the binding energy for specific isotopes. And what I found through research is that these two, the Wolfram database and the formula, have very different binding energy results. And I'll explain why later. So, yeah, I decided to graph the differences in between these two, the database and the formula. So to start off, I wrote a function that's the Beta by Sacra formula. A lot of variables here, like volume, surface area, asymmetry, stuff like that. And these are all constants that can be changed. And the reason. I'll explain why. The reason why the database and the formula are different is because there's a rounding difference. Actually, I remember this one time I talked to Stephen about it. I was really confused on why there are different results. So I talked to Stephen Wolfram about it, and he was like. He explained to me why there's rounding. There's like, rounding differences inside the formula for these constants. And these rounding differences are used a lot because we could, like, researchers, scientists can experiment with different types of variables. Like, if you want, like, the gravity to be stronger, you could increase this number, this constant, and stuff like that. So from here, I just calculated the binding energy of multiple or adjusted uranium, actually, for this part. And then down here, I created a plot of the binding energy of the database and the formula.
And okay, so for. For this plot, do you want to kind of elaborate a little bit on, like, the axes and kind of like what the. What the heat map means?
Okay, so I created a list density plot of calculated binding energy. And so calculated binding energy. It just takes an isotope name, like for. For the formula, you know, how I created this function. It takes an isotope and it returns the mass number, the atomic number, and the binding energy. So if you see here, there's a X, X axis, a Y axis, and the binding energy. So what I did is I did. I made a matrix which is the mass number, atomic number, and binding energy in the form of a 3D XYZ matrix. And I basically just grafted. Created matrixes. Grafted. Yeah.
So got it. So that makes sense. So the. So, like, looking at this, the binding energy goes up as you have kind of the heavier atoms.
Yeah, ye. Yeah, of course. And I basically did the same thing here. I took the Wolfram database and literally did the same thing with the X axis, the Y axis, and the Z axis. And actually, I'll go over an issue I had when I was doing my project There is an issue where some elements in the Wolfram database and the Bethel Weissacker formula, they weren't like equal. Some, I don't know. In the Wolfram database, maybe some data wasn't recorded and some isotope wasn't like listed in there and it wasn't found. So what I had to do is I had to delete cases right here. And the reason I, I deleted all the cases with times is because in the Wolfram database if a value was missing or it wasn't recorded, there would be just like a, like a X and then times and then a number. It would be like something times something. It wouldn't calculate. So it would just be like X times Y while the other variable, the other isotopes were like numbers multiplied with an outcome. So I just did these cases.
Yeah.
And then I simply just subtracted it and I took that absolute value because you don't want your values to be negative. And I got this very beautiful heat map graph.
It's really interesting. It seems like there's not really any pattern. Yeah, yeah.
Yeah.
So in terms of like the missing data, was there a lot of missing data in the Wolfram repository or were there like not that many examples?
No, there wasn't that many. I don't think there was much. Well, yeah, I just had to delete a couple cases. Yeah, pretty much it weren't that much missing data.
Yeah, I mean looking at this, it looks a little bit like there's not really any pattern overall. But there's like. I see it looks like there's like two kind of bigger hotspots where the entire area is brighter. Yeah, it's pretty interesting trying to think about why, because it seems like you said the main discrepancy between the two is rounding errors, so you would think it might have a bit more of a pattern, but it doesn't really look like it.
Yeah. And actually later on I'll talk about how I found the parameters and I found a difference in these parameters. I'll continue on here. I estimated the parameters for the formula. I try to do a best fit model and like I explained before, like there the many people use different constants, they round differently for different uses. And so I used a bind fit model to find better values for these constants and I had to like retrieve the mass number, atomic number and binding energy for each isotope. I had to clean the data set and then I had to find the binding energy using and find binding energy model to estimate the parameters using the find fit function.
I see. So is this is this part where you're kind of like estimating the best fit parameters, is this kind of where the discrepancy between the two come up since you end up using like slightly different constants?
Well, I mean there are different, they're supposed to be different constants and actually they're like. What I mean by this is that like I said, all the uses are different. Like constants are going to be different for every single use. And in this one website that my mentor gave me, I read about it and it talked about this formula and there's a like a plus minus of like a number that could be for these constants. I think I talk about it here. Well, what I mean is there like a plus minus, like x plus minus one. And that means that the number could be between X minus 1 and X plus 1.
There's like a small margin of error for each of these.
Yeah, yeah, that's what I mean. And my parameters fit in that margin of error.
Okay. Okay, that makes sense.
Then I found a percent error using numbers. Pretty much just found a nonlinear fit model. And this non linear model fit, it provides information that find fit doesn't provide. I also graphed it, I mean made the grid so it looks pretty.
Okay, so these, what's, what's in the table are the different percent errors, right?
Yeah.
Okay, so I mean it looks like most of them are actually quite small. So it makes sense that they fit within the margin of error.
And this is where I talk about the margin of error.
Okay, so the one you saw in the article was like plus or minus one.
Yeah. And mine fit in that.
Yeah, all of them are indeed.
Okay, let's see. Pretty similar. And then I found the energy loss. So the energy loss is basically after an isotope decays, it releases a little bit of energy. And as it goes on in like the big graph that I showed before, there's a lot of energy loss, as you can see. And so what I did is I found the binding, I mean the energy lost after it fully decays. So yeah, to do this I copied the code from the previous section just without the slider and without with arrows to visualize it better. And what these arrows are, it means in how many places it decays into. Into. You see that uranium 235 decays into four different elements. You see four different arrows pointing at. So I use the function vertex out and vertical vertex list to see how many isotopes uranium 235 decays into in their name. And when you see that there are zero arrows pointing out we can find out the final form of that isotope.
Okay, so you're looking at. Yeah, go on.
This little dot, it doesn't have. It has zero, like vertex is coming out, zero arrows pointing out. So that means it's the final form of this isotope.
Okay. So essentially you're looking at like the endpoints of when it's decayed, like all the way down. And it will, like, it's breached a stable form at those, like, end points.
Okay. Yeah, yeah. And from there I just found the energy released. I found the mass number and the atomic number, and then I from there I found the energy released.
Okay, so that is. That's like line 198. Is it the energy loss for each of those? Interesting. Okay, yeah. So then, now that you have these energy loss for each of the isotope decompositions, I'm just thinking of in the future, if you want to visualize that along the map that you had earlier, where it's decomposing down and you have the arrows pointing like maybe because I'm imagining, and correct me if I'm wrong, for the decompositions from one down to another, you have a different loss of energy for each of those decompositions. So maybe one thing you could have in the future is you highlight the edges that are connecting. So if one thing decomposes to another and it has a higher binding energy, then you highlight that edge to be, for example, a darker color. So that way when you look at the entire thing of, for example, what Uranium 235 is going down through all of those four rows, you can see along each of the edges which one has the highest energy loss and which one has the lowest energy loss.
That could be potential extension for my project. And actually I had a couple other extension ideas for my project. If you want, I could talk about that right now.
Yeah, that would be great.
Yeah. So an extension I had and I talked about with, with my mentor and I didn't have enough time or else I would have done this. But for my project that I mentioned that I looked at the decay rates and the energy released from isotopes. Well, there is a rule called the Sergeant's Rule, where it states there's. There's a correlation between the reaction rates and the amount of kinetic energy released. And so I want to do something with that. I'm not sure what. I have to do some research, but that's possibly a direction we could go to. I'd have to find what to do with that. But that was something I was thinking.
Yes, for sure. And then Also, kind of in terms of thinking about isotope decay, are there areas where this kind of study is particularly useful for scientists to use?
Actually, funny story. When me and Stephen were talking during, like, when I was choosing my project, he talked about a professor at Harvard, I believe, where he went on an expedition to find radioactive isotopes that were. That fell down as a meteorite from space. And I guess that kind of inspired my project where I just did a bunch of research and maybe help, like, using the Wolfram language, I could maybe help scientists, like, determine the binding energy loss or what it decays to using the database, of course. And you can also compare it and stuff like that.
Yeah, that seems really helpful. So, another thing that I'm curious about, you mentioned a couple potential future directions with this project. Specifically, I'm just wondering, in the broader sense of things, if you had any other projects or areas of interest that you might be interested in doing a project with Wolfram in.
Yeah, Ashi, There were maybe two projects. So I'll. I have a strong interest in basketball and, of course, space right here. But on the term of basketball, I didn't really have a project idea. But when we're talking about space, I did have two projects, and they were. I really wanted to model the explosion of a star, which is a supernova, basically. One of my friends actually did the. For modeling of a galaxy. And I actually really liked this project. So I also want to do that if I get another chance at making a project. And the reason why this explosion of a star didn't get chosen is because when I talked to Stephen about it, he said that we need. I need more knowledge on, like, differential equations and calculus. And since I was a freshman at the time, I only took pre calculus honors. No, I didn't really have that much experience in that. So that was one project. The second project I wanted to do is to find optimized travel routes to Mars in a spacecraft.
But.
Yeah, but once again, Steven said that I need to use differential equations, so I meant no project for me. And so.
Yeah, well, yeah, I think. I think the really awesome thing about Wolfram is that you're able to do these really complex projects, and it really makes it a lot easier. Like, you mentioned basketball. And I think actually there's a lot of cool projects that you could easily do with, like, for example, modeling balls or, like, shooting baskets. And the really awesome thing is once you take the calculus classes or whatever, then you can easily go in these more complicated projects. And I know that Wolfram also supports a lot of functionality. For example, for differential equation solving, they have ndsolve and things like that, so it'll be really exciting to see those. All right, well, good luck on all your future projects, and thank you so much for coming on the podcast and sharing.
Thanks for listening to this episode of the Wolfram Student Podcast. We hope you learned something new and took away insights from today's discussion. If you want to learn more about Wolfram summer programs, research opportunities, or be featured in a future episode, check out the links in the description below. Be sure to tune in for our next episode. This is your host, Tianni Gu, and thanks for listening to the Wolfram Student Podcast.
More from Guy


Cheryl Strauss Einhorn | The Human Edge: Smarter Decisions in the Age of AI | Talks at Google



Rachel Glennerster | Innovation and the Center for Global Development | Talks at Google

Rebecca Winthrop | Rethinking the Purpose of Education in the Age of AI | Talks at Google

Dr. Robert Wachter | A Giant Leap: How AI Is Transforming Healthcare... | Talks at Google



