13 Formulas Critical for the PMP Exam
The video is an instructional lecture aimed at PMP exam candidates, focusing on Earned Value Management (EVM) and the 13 essential formulas they must master. It begins with an overview of EVM, explaining how it integrates cost and schedule performance to assess project health. The presenter walks through a concrete window‑installation scenario, calculating each formula step‑by‑step: Budget at Completion (BAC), Planned Value (PV), Earned Value (EV), Actual Cost (AC), Cost Variance (CV), Schedule Variance (SV), Cost Performance Index (CPI), Schedule Performance Index (SPI), Estimate at Completion (EAC), Estimate to Complete (ETC), Variance at Completion (VAC), Cumulative CPI, and To‑Complete Performance Index (TCPI). For each, the definition, mathematical expression, numeric example, and interpretation (positive/negative, >1 or <1) are provided. The lecture concludes with memorization tips—"variance = subtract, index = divide"—and a call‑to‑action to enroll in a free PMP preparation course. The content blends technical explanation with motivational encouragement to help learners confidently tackle the exam’s math section.
Chapters
On your PMP exam, you will have a number of math questions, and this section tends to be the section that candidates tend to freak out about. But if you know these 13 critical formulas, you will ace this section with flying colors. Now, before we get started, if you have not done so already, make sure you check out our free course at www.exampm.com/free where you can learn how you can obtain your PMP certification In the next 6 weeks. So in this lecture, you are going to learn the earned value formulas that you need to know for your exam and how to solve these type of math questions. So what is earned value analysis? Earned value analysis compares the performance measurement baseline to the actual schedule and cost performance. It combines the variables of time and cost. It compares the tasks that have actually been completed with what you have planned to do, and it also provides performance indexes in order to tell you how far along of the progress have you progressed in your project.
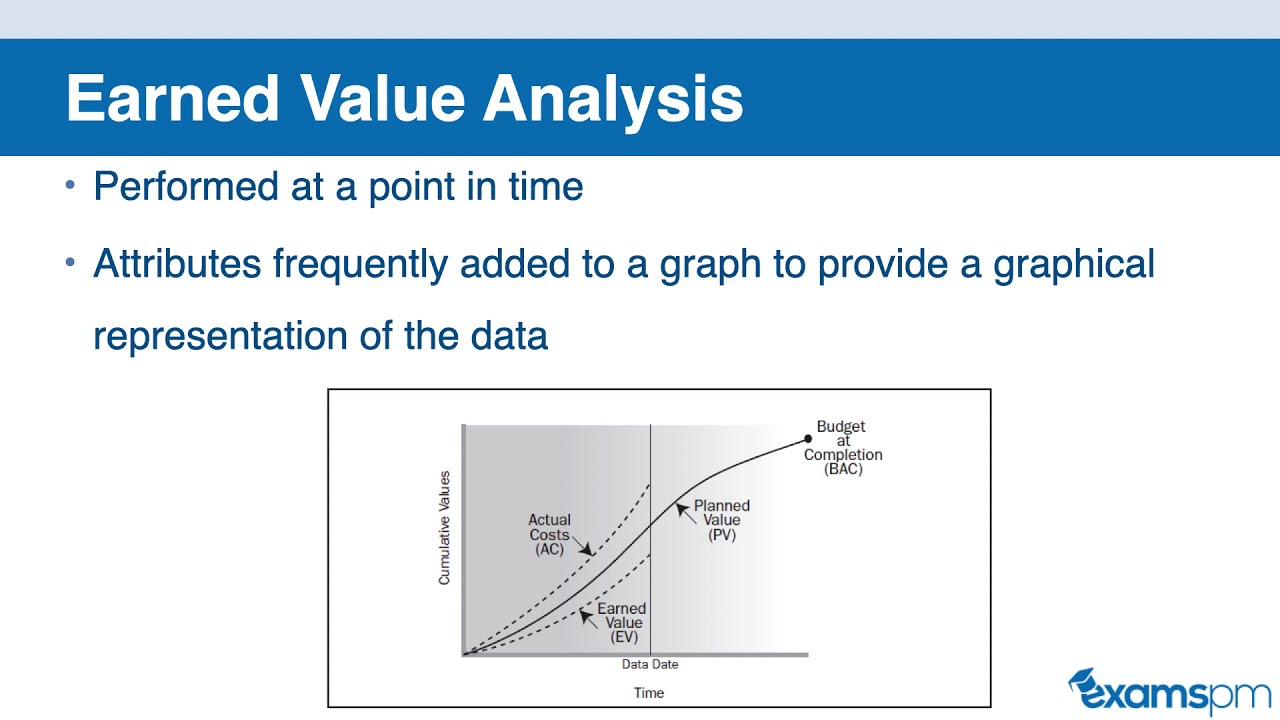
Earned Value Analysis allows you to assess the performance of your project at any given point in time. The attributes that you gather from your project is plotted onto a graph to provide a graphical representation of this data. So here we can see that we have plotted our planned value, which is where we plan to be on our project, but we also planned the Earned Value, which represents how much work we have actually done and the actual cost we have spent. So this allows you to see the health of your project in a snapshot. Now let's take a look at a scenario and some sample questions that you may see related to Earned Value Management. So our scenario here is that you are a project manager for the installation of 40 windows. According to your plan, each window will be $7,500 per window, and this installation will take 16 weeks to complete. Now, for our first formula, we are going to take a look at the BAC, or the budget at completion. The budget at completion is a sum of all budgets established for the work to be performed. So this is how much you estimated for the entire planned cost of the project. There's no formula that exists for the BAC. How you calculate this is you would sum up all of the individual costs you have estimated at the start of your project to get the total cost. So in our example, because we know that each window is going to cost $7,000 $7,500 to install and we have 40 windows here. 40 times $7,500 gives us a budget at completion of $300,000. Our second formula is the planned value. So unlike the budget at completion, the, the planned value tells you how much work you have completed at a certain point in time. The budget at completion tells you how much you should have completed at the end of the project. So in other words, a planned value, or PV, is how much work you have planned to finish at any given point in time expressed in dollars. This is the authorized budget assigned to the scheduled work at a specific point in your project. So for example, in week 2, maybe you have planned that you will finish $50,000 of the work. So the planned value formula It's planned percentage complete times the budget at completion. Now let's go back to our example here. Let's suppose that in 4 weeks we expect to complete 25% of the 16-week schedule, and we know that our planned value formula is planned percentage complete times the BAC, or budget at completion. So applying this formula, since we know that we should be 25% complete and we know that our budget at completion from the previous formula is $300,000. So we do 0.25 times $300,000, then we get a planned value of $75,000 by week 4. Our next formula, the third formula, is the earned value, or EV. The earned value is a measure of work performed expressed in terms of budget authorized for that work. This is based on the assumption that as you complete work on the project, you are adding value. When the planned value is what is planned, the earned value is going to equal the planned value. So if your project is progressing exactly the way that you have planned for it, then the PV and EV are going to equal each other. The formula for earned value is actual percentage complete times the budget at completion. Now going back to our example here, let's suppose that 8 out of the windows, out of the 40 windows, is 20% of the project, and we have finished installation of 8 of these windows. Applying our formula here, EV, our earned value, is the actual percentage complete times the budget at completion. So we do 20% Times $300,000, and it gives us an earned value of $60,000. So we have earned $60,000 of value for this project. Our 4th formula is actual cost. The actual cost is the realized cost. So this is how much we have actually spent on the project for a specific period of time. This is simply the amount that has actually been spent to produce what we want it to produce. So we sum up all the costs that we have spent up to a certain point in the project, and that is our actual cost.
Now let's take a look at our existing example. So you are the project manager who is responsible for installation of 40 windows. According to your plan, each of the window will cost $7,500 to install, and it will take 16 weeks to complete this project. 4 weeks into this project, you have already spent $55,000 and you have completed 8 windows and you want to report performance and determine how much time and cost remain. So we are told in this example that the actual cost that we have spent at this point in time, so 4 weeks into it, into this project, was $55,000. So there's no calculations needed in this example. We are told by the question that our actual cost here is equal to $55,000. Now let's go on to formula number 5, and this one is cost variance. So cost variance is the amount of budget deficit or surplus at any given point in time, expressed as the difference between the earned value and the actual cost. In other words, this is how much the actual cost varies from the planned cost. So it is a difference between what you planned to spend and what you actually spent. The formula for earned— for cost variance is earned value minus actual cost. So going back to our example of the Windows installation, you may recall earlier that our earned value was $60,000 and our actual cost here was $55,000. So If we plug this into the formula, we get that our cost variance is $5,000. Now, not only do you need to know how to calculate these variances for your PMP exam, you also need to know how to interpret them as well. So if the CV or cost variance is a positive number, so above zero, then you are under budget and this is good. If your cost variance is below 0, or if it's a negative number, that will show that you are over budget, and this is bad. If your cost variance is right at 0, this means that you are right on target, you're right on budget. The last thing that you should note about this formula is that we're using earned value here instead of planned value or PV because we want to know how much is varied from what has been spent, not Not what was planned to be spent. So we want to know what is difference between what is the product that we have, what is the value of the product that we have created, minus how much we have actually spent, not how much we have planned to spend. So that's why we use EV here instead of PV minus AC. So the formula again for cost variance is earned value, EV, minus AC. Actual cost, AC. Now let's go on to our 6th formula. Our 6th formula is schedule variance. Like cost variance, the schedule variance is a measure of schedule performance expressed between the difference of the earned value and the planned value. So the schedule variance is going to tell us how much our schedule differs from our plan, and it expressed In dollars. So the formula for schedule variance is earned value minus the planned value. So going back in our example, you may recall that in our previous example of Windows installation, our earned value was $60,000 and our planned value was $75,000. And so in this case, we get a schedule variance of negative $15,000. So Not only do you need to know the formula for calculating this, you will also need to know how to interpret this as well. The interpretation for schedule variance is that if it is a positive number, then you are ahead of schedule. If it is a negative number, then you are behind schedule. And if it is 0, that means that you have done exactly what you plan to do and you are right on schedule. So because our schedule variance in this case is a negative number, this tells us that we are behind schedule. Now, the cost variance and schedule variance tells you how far you are, how much you have deviated from your plan in terms of cost and schedule. However, sometimes on some projects, you want to express this in an index or a percentage instead of an absolute value, and this is where the cost performance index and schedule performance index plays So the cost performance index is a measure of cost efficiency of budgeted resources expressed as a ratio of earned value to actual cost. So it tells us how much we're getting per dollar. So the formula for cost performance index is actually similar to cost variance. So the formula For Cost Performance Index is earned value, or EV, divided by actual cost, or AC. So instead of subtracting like what we did in the— when we are doing the variances, when we want to express it as a ratio or a percentage, then we divide instead. So from our installation windows example, our earned value was $60,000 and our actual cost was $55,000. And so if we divide the two, 60,000 divided by 55,000, we get a CPI of 1.09. Now, like the variances, you not only need to know how to calculate these formulas, you will need to know how to interpret them as well. So if the CPI is greater than 1, then you are under budget, and this is good. If the CPI is less than 1, this means that you are over your budget and this is bad. If the CPI is right at 1, then this means that you are on budget and on plan. Similarly, we can also express our schedule as an index or ratio as well, and this is called the Schedule Performance Index or SPI. This is a measure of schedule efficiency expressed as a ratio of earned value to planned value. So the SPI tells us how fast the project is progressing compared to the plan. Now using this and using our previous example of the Windows installation, we can now do an example where we calculate the SPI. So the formula for SPI is earned value divided by the planned value because we're getting the ratio here instead of earned value minus planned value, which is what we saw in the schedule variance, we're dividing here instead. So whenever you see index, remember that you are dividing. So when we plug in the numbers from our example, we know that our earned value is $60,000 and our planned value was $75,000. So $60,000 divided by $75,000 gives us an SPI of 0.8. Now, is this good or bad? Well, here is how you can interpret this. So So if the SPI is greater than 1, then this means that you are ahead of schedule. So at that point in time in the project, you have done more than what you have planned to do, which is good. Now, if the SPI is less than 1, that means that you are behind schedule and this is not good. So because the SPI here is 0.8, this actually tells you that the project is progressing at 80% of the planned pace. So you're not doing really well here. And if the SPI is right at 1, then that means that your project is right on schedule. Now let's take a look at our 9th formula, and that is EAC, or Estimate at Completion. This is the expected total cost of completing all of the work expressed as a sum of the actual cost to date and the estimate to complete. So in other words, when you are reestimating at a certain point in your project, your budget at completion may not always be accurate if your cost is less or more than what was expected. So when you're reestimating at a certain point in your project, you will get your estimate at completion. When you're estimating the entire cost of your project at the start of your project, you will get your BAC or budget at completion. Essentially, this is a re-estimation of how much your project would cost when it is completed at a certain point within your project. Now let's take a look at an example here. So the formula to calculate your estimate at completion is BAC, or budget at completion, divided by the CPI, or the cost performance index. So the cost performance index tells us how quickly we are spending the— how efficient we are at spending our budget. So if it is above 1, that is good. If it's below 1, that is bad. Essentially, at a certain point in our project, we want to adjust the project based on how much we're actually spending, the ratio that we are spending this budget, in order to get a more accurate look at how much we're actually going to complete this project by. So we know that in our example that our budget at completion was was $300,000 and our CPI was 1.09. So when we do $300,000 divided by 1.09, we get an EAC or budget— or estimate at completion of $275,229.36. So basically the interpretation that we can get from this formula is that at week 4, what we can see is that we can, if If our cost continued to progress at the rate that it has in the first 4 weeks, then we can complete this entire project for $275,229 instead of $300,000, which is good because we're coming below budget. So we're actually doing better on cost than what we have planned to do, and the EAC reflects That. Our 10th formula is our ETC, which stands for Estimate to Complete. So this is how much we expect the cost to be that we still need in order to finish the work remaining on the project. It is how much we expect to spend at a certain point to the end of the project. So this is how much we still need to spend in order to finish This project. The formula for ETC is EAC minus AC. In other words, how much we budget this entire project to cost us minus what we have actually spent or the actual cost. So if we plug in the numbers from our previous examples, we know our EAC was $275,229.36. We also know that our actual cost was $55,000, and we when we So when we subtract the 2 values, we get that our ETC is $220,229.36. Next, for our 11th formula, we have the VAC, or variance at completion. This is a projection of the amount of budget deficit or surplus expressed the difference between the budget at completion and the estimate at completion. So this variance is going to be the difference between what we originally budgeted and what we expect to spend. So the formula for variance at completion is our BAC. Remember, this is— the BAC is how much we have estimated our project to cost at the start of our project, and the EAC is how much we forecast the project, the entire project, to cost at a midway, where a point in our project when we're re-estimating it. So in our example, we re-looked at the cost at week 4 and made a new estimate of how much the project will cost when it's completed. So when we do those estimations at certain points throughout our project, we get the EAC. So the difference between the two will be our VAC. So plugging in the numbers from our examples, we know that our BAC was, was $300,000 And our EAC was $275,229.36. When we subtract the two, we get that our variance at completion, or VAC, is $24,770.63. Now here is how we can interpret the VAC. So if the VAC is a positive number, then that is good. That means that we are doing better than what we have projected. If it is a negative number, number, that means that we are running over budget and that is bad. So positive VAC is good, negative it is bad. In this case, we have a positive number. That means we're doing better than what we projected that we would do. So here's a graphical representation of all of the formulas that we just saw. We see the EV here, the PV, the AC, the VAC, the BAC, the EAC, and the ETC all represented on this graph. So if you need a visual representation Of all of the formulas that we just spoke about, take a look at this chart here. Now moving on to formula number twelve, we have the cumulative CPI. So this is essentially the same as CPI, except we're adding up all of the earned values and adding up all of the actual cost across all of the periods, whether they are months or quarters, whatever. So essentially, we're just adding up all of the previous EVs and ACs and. Dividing them. So the formula for cumulative CPI is the same for CPI. We're just using our earned value divided by our actual cost. And so the math is the same as CPI. The interpretation for this is the same as the normal CPI as well. If it's greater than 1, then we are under budget. If it is less than 1, then we're over budget, so it's bad. If we're right On one that we're on budget, so we want our indexes whether they're CPI or SPI to be greater than one. Finally, we have our TCPI, which is our final formula that you need to know for your upcoming PMP exam. The TCPI is the to complete performance index. This is a measure of the cost performance that is required to be achieved with the remaining resources in order to meet. Specific management goal. It is expressed as a ratio of the cost to finish the outstanding work to the remaining budget. The formula for TCPI is budget at completion minus the earned value divided by budget at completion minus the actual cost. So plugging in our numbers from our Windows installation project, we get our budget completion, which was $300,000, minus $60,000, which was our earned value, divided by $300,000 minus our actual cost, which was $55,000. And so this gets us to $240,000 divided by $245,000. And so we get a TCPI in this case of 0.9796. So there you have it, all of the formulas that you'll need to know for your upcoming PMP exam, all 13 of them listed here on this slide. So a few quick tips to help you memorize them: whenever you see variance, think subtract, and whenever you see index, think divide. So, and feel free to just note down all 13 of the formulas that you see here. It is going to help you with the sections of the PMP exam. And if you haven't done so already, be sure to sign up for our free course where we will share a lot more tips and tricks to help you pass your exam in the next 6 weeks. And to sign up, just go to www.examspm.com/free to sign up for this free class and learn all of the tips and tricks that you will need in order to pass on your first try. Can't wait to see you in our course. Thank you so much for joining me for today's today's training.
More from Helena


How to Use Claude Code to Get UNLIMITED Leads in 6 Mins | Best Lead Scraping Tool



These AI Videos Has 21.5M Views — Here's the Exact System (Fable 5 + Higgsfield)




NotebookLM 2.0 Update: Analyze Your Entire Business in Minutes! (Full Tutorial)