How I Made $22,700 With One Trade on NAS100 | Full Breakdown
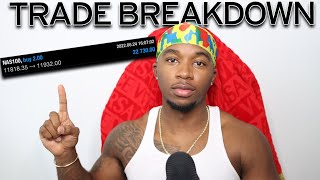
Trader Josiah Stewart breaks down a $22,700 NAS100 trade using supply-and-demand zones and session analysis. He entered at 11,787 during the New York session breakout, hit a 6.5:1 risk-to-reward setup, and closed the first target in 45 minutes for 136 pips.
Chapters
What is goodie, my people? We are back again with another gem. Listen, today I am going to be doing something that people have been requesting for the longest of times. You guys know if you follow me on Instagram— I highly suggest you follow me on Instagram over there, @jubra_— I've been trading heavily for the past couple months, and today I made $22,000 with one single trade, almost $23,000. And people have literally been DMing me so much saying, can you do video breakdowns of your trades or trade breakdowns? I'm posting Now why my mic just trying to fall like that? But usually I keep you guys updated on my trades. If you're in my Discord, you guys see me taking trades. I also be calling out trades sometimes. I'm coming out with a full signals chat as well, so stay tuned for that whenever I decide to actually do that. But today we're going to be hopping in. I'm going to be breaking down this trade exactly when I took it, why I took it, and, um, also we're just gonna vibe out and I'm gonna show you guys how you guys can kind of do it for yourself. So if you're excited for this video, smash the like button, subscribe if you're not subscribed already, and hit the post notification bell so you can be notified whenever I drop these gems. Because these are the type of gems that you literally watch, and then you keep watching it 5 more times, and after you watch it the 25th time, you go and repeat what the heck I did, and then you become a billionaire. Like, that's, that's what these type of gems is. So you're gonna want to be subscribed with the post notifications on. But without further ado, let's just hop right into this. Wait, wait, wait, before we hop into this video, we gotta shout out our sponsors for the day. You know who that is? Cryptfyacademy.com, you know what I'm saying? If you guys don't know, I have a whole academy. I teach you guys all the steps that you need to become a successful trader, whether it be in crypto or DeFi. I go into the psychology, I go into how to find these crypto coins, I teach you how to read charts, how to predict the price of coins as well in there. So if that's something that sounds very intriguing to you, cryptfyacademy.com, you know what I'm saying? It's the first thing inside description, it's also right up there. Highly suggest y'all go check it out. We have different people that are making a bunch of money. If you follow me on Instagram, you see me posting screenshots all the time of people posting $500 days, $1,400 days, $3,000 days. It's crazy. And it's all from stuff that they learned in the academy, which is absolutely mind-boggling to me. It's actually, it's very, it's like a proud dad moment. You know what I'm saying? I feel very, that's like one of the best feelings in the world when people send me these testimonials that they made so much money from stuff that I was able to teach them. But that's besides the point. If you still are not like on the fence about it, you know what I'm saying? Go to the website, this whole testimonial page where. I show you guys a bunch of things that people have said about the academy and what they've been able to get out of the academy so far. So if that sounds like something that's interesting to you, cryptofyacademy.com. But without further ado, let's hop right into this. All right, so boom, here we are on the NASDAQ, you know what I'm saying? This is what I traded this morning. Usually I trade the NASDAQ in the mornings, and then sometimes like during the evenings or during the day, I'll trade Ethereum if I see any setups. But the first thing I do when I come on the NASDAQ, I'll show you guys exactly how I was able to— this is the trade right here. I'm in rewind mode right now, but I was able to make 136 pips on this one move. It was a 6.5:1 risk-to-reward ratio, like you see right here, which is a great, absolutely phenomenal, beautiful, muy bien trade, you know what I'm saying? But I'm gonna show you guys exactly what I saw and why I hopped in this trade, why I was confident enough to put my money where my mouth is. So the first thing I do, and just to kind of give you guys more of a visual representation, I come over here on my indicators. I have this indicator called Kill Zones, and it just shows me like the time frames, right? It shows me the different sessions. If you didn't know, We have the Tokyo session, the London session, the Sydney session, the New York session. We have all these different sessions and certain coins or certain currencies move more in certain sessions. So I know that the NAS 100 moves a whole bunch inside the New York session and that's what this white line symbolizes. So let's just go forward inside this whole replay mode. Right now we're in the red right now, well, the red zone. Okay, so in this yellow zone, right, this is, this is the, um, London session. This is like in the middle of the, in the middle of the night. I don't trade that session at all because I'm sleeping, you know what I'm saying? But I'm seeing that it's making this support area right here. It came— this is on the 15-minute time frame, which is mostly where I do my markups on, uh, most of the time. I want to see the overall trend on the hour or the 4-hour chart, like higher time frames, and then I'll really just be looking, um, on the 15-minute time frame to find my supports, resistance, supply and demand zones, all of that. So, um, yeah, so I see right here on the 15-minute chart that it's just making a bunch of touches. We have one touch in this area right here, we have another touch and rejection in this area right here. It came up and back into the area and rejected back up. It came down again in this area and rejected back up. Now keep in mind, this is at 2 o'clock in the morning, so I'm not seeing this play out. This is what I'm seeing when I come to my computer. I'll show you guys exactly what I saw as soon as I came to my computer in the morning. I also see like a trend line coming down, um, in this area too. That's why I have this trend line. We had a touch right here, we also had a touch right here, and, um, we're kind of entering into a squeeze type of motion. Now I talked about the squeeze strategy inside my CryptFi Academy. It's a scalping strategy that I've been using. It works freaking phenomenal, you know what I'm saying? Um, but I talked about inside my CryptFi Academy if that's something that interests you. Again, you know where the heck to get it. But let's fast forward some more. Um, so then we see another touch right here, and let's get my drawing tool. We see another touch right here and then a rejection off of it. And this white line is the start of the New York session, which is the session that I trade. So I know at the beginning of this session, most of the time, if we scroll back and look at this time frame, as soon as it passes this white line, you start seeing a bunch of movement. We now are seeing movement up, down, up, down, up, down, crazy ups and crazy downs. It really most of the time doesn't move that much in these two sessions, mainly the yellow session. But I know as soon as it's in the white session, it goes crazy. Like right here, as soon as it crossed the white line, we see it had a big spurt to the upside. We can— I can do this all the time. White line, past the white line, crazy movement up here. This white line, this one's kind of dead. This one, we have some crazy movement up and down, up and down, up and down. So I know as soon as this session hits that's when a lot of movement starts happening. So I was already looking for entries here. The thing that I've noticed with the NASDAQ that since I've been trading it the past couple, uh, weeks— because most of the time I used to only trade like Ethereum or like GBPJPY, but I started trading NASDAQ a few weeks ago and I've been backtesting it. I've spent so many hours backtesting this pair. Like, it's, it's actually a really fun pair to trade because it's very volatile. If you follow me on Instagram, you saw like the candle moving like crazily. It goes up and down like extremely fast, especially in the— at the beginning and during this, um, New York session. But like I was saying, at this point I'm looking for entries. I know that most of the time if you're trading the NAS 100, this is something that I've kind of gotten over the few, uh, over the weeks that I've been studying this, in the hours and hours of backtesting that I've been backtesting on the NAS 100, is as soon as it breaks the range that was inside the yellow section session, um, that's the direction that is most likely going to keep going in for the whole rest of the day. I can show you an example of that if we come right— well, this one's like up and down, up and down. So, okay, perfect, right here. So this yellow session, we had a whole range right here. We had right here, then it came up, up right here. And as soon as it broke out of this box, I knew that it was going buys only because it broke out of the range that it was in during the yellow session. This happens all the time. Again, right here It was in this range. I just waited to see if it broke out on the downside or on the upside. And if it breaks out on the upside, I'm only looking for buys that day. If it's breaking down on the downside, then I'm only looking for sells that day. This one was really choppy, um, really choppy. But at the end of the day, you guys see what I'm saying. That's really how I go through it. So I'm seeing it perfectly, perfectly in the yellow session. It is just in this consolidation period. So let me erase some of this though so y'all don't get confused. Actually, I need my box still, but, um, I see it's consolidating inside the yellow session, so I'm really just waiting to get confirmation, um, that it's going to go in either direction. But I already personally had a bias just due to the fact that we're in an uptrend right now. If you look right here, we had up, down, up, down, up, down, up, down, up, down. But I'm seeing on the hour time frame that we are literally in an uptrend. We had a low here, um, higher high, a higher low, a higher high. And then, um, I'm seeing all this. Remember I told you guys I go on the higher time frame just to see the direction that the price is moving, then I'll be on the 15-minute time frame for the majority of the time just to get my entries and also to mark up my charts and everything like that. But I just want to see the overall direction on the higher time frames. So I'm seeing that we're on a uptrend, I'm like, okay, most likely we're going to go up. The next clue— I cannot say this word— confluence. There it goes. The next confluence that I saw, because when you're entering a trade you want multiple different confluences, you want multiple different reasons as to why you think a price is going in a certain way. So my next reason as to why I think the price is going up is that this area right here, it just could not break this area. It kept trying to go low and getting rejected. It kept trying to go low and get it rejected. We have multiple touches here, here, here, here, and here. I'm seeing all this, I'm like, okay, most of the time if it keeps hitting a point, it does not want to go through that point. So I'm seeing this, I'm seeing, okay, it does not look like it wants to break through this area at all to the downside. So I'm like, let me look for buys. So What do I do? I wait for another candlestick. This is the green candlestick, then we have another red candlestick, and this is actually where I hopped in, where I saw this rejection on this, uh, red candlestick. Because I was looking at it in real time, it was coming down here, then it would go up real fast, down here, up real fast. So I'm seeing this all happen in front of me, so I'm like, okay, it really does not like this area. So instead of waiting for another, um, confirmation— because most of the time I would wait for another candlestick, before I enter into a trade like this. Instead of waiting for that, I was like, let me just hop in right now, and that's what I did. This is exactly where I hopped in at, at this point right here, the 11,787 area, and I entered my position. Um, first candlestick was green, great. I needed it to— the one thing that I needed in order for it to, um, completely validate my trade was to break past this trend line. So we did have a little bit of resistance at this trend line when it came up to this trend line. If we go to the 5-minute chart, you'll be able to see it a little bit better. I'll remove this indicator for now because we don't need it anymore. But, um, we did have some resistance at this trend line, I believe, on the next candlestick. Oh no, we didn't have— I thought— well, me watching the chart, so I'm watching it, right? Maybe it didn't print on one of the candlesticks, but I'm watching the chart and I'm seeing price go up here, then all the way down here, up here, then all the way down here, like multiple times. So I'm— it's some— there was some resistance at this trend line, but ultimately it did end up breaking the trend line and closing above the trend line, even on the 5-minute chart. So this really validated the trade for me, but I— it was already a huge jump up, so I wasn't going to enter another position, because usually if a trade is more validated, I would enter into another position because now I'm more certain that the price is going in the direction that I said it's going to go in. But, um, in my trades I always have multiple different TPs because there are multiple different levels that it can reject at. My final TP was set at the last high. So let's zoom out really quickly just so you guys can see this a little bit better. Okay, so this is the, uh, trade right here, and I set it for the last high was this area right here because it hasn't been in— it hasn't been this high up since this time frame over here. So that was my last, uh, or my, my final TP area. Um, then I had multiple other TPs which I'll show you right now, and I'll show you exactly why I had those TPs. Let me go to the 5-minute. I believe I had 2 or 3 TPs. Um, the first TP was right at this line because that was the last high, so I wanted to break that line. It was also at the trend line. I also had another TP at, um, this area right here, I believe, just because I usually like to put a TP in the middle of all of my trades just in case. Usually the first TP, I'll just move my stop loss, um, to break even so there's no way I lose the trade. Then the second TP, I'll take a little bit of my tradings off unless I see it's heavy in momentum, which, um, it was a lot of momentum going behind this, so I didn't even take another position or take out part of my position at the second TP, and then my final TP was up here. Now, I could have kept the trade, I could have held the trade longer, but I decided not to just due to the fact that I'd rather just cash out on my 136 pips, which is absolutely freaking amazing. Now, if we fast forward, we can actually see that price did hit my TP in like 45 minutes, I believe, and I cashed out $22,700, I believe. The screenshot is all— I, I could put it up there. Hopefully I remember to put it up there. But it was in the— if you go to my Instagram, you'll see it. It's also in the thumbnail, most likely, because gotta flex the numbers to get views. But, um, I ended up actually getting in another trade right here. Um, it was basically just like a retracement trade for me because I knew it was retracing down and I knew it would end up going back up. It was also creating a nice support zone in this area right here. We see it was, um, really the same exact thing I saw earlier in the session. It was just respecting this area right here. So, um, I decided to hop in another trade, and right now that trade is doing pretty well. I believe it's— yeah, I think we hit TP1. TP1 was right here like I told you guys. TP2 was right in the middle, so we didn't hit TP2 yet. And then the final TP is up here. That would be another 100— another 298 pips. But that is my breakdown for the— for for that trade, for this trade specifically, I should say. Um, I don't even know why this box is here. I didn't even take a trade right here. Anyways, we'll just delete that. But that is the end of my breakdown. Hope you guys enjoyed it. Hope you guys saw my point of view. Usually I like to trade supply and demand zones and support and resistance zones, like, and the support and resistance zone, the support and resistance zones have to be like, like perfect for me to trade them. I love supply and demand zones. I'll trade them every freaking day. But the support and resistance zones, they have to be like perfect for me to hop in a trade. And this one to me was absolutely freaking perfect, so that's why I hopped in. That's really about the end of my breakdown. I don't know what else to say. Um, hopefully you guys were able to get something out of it, see my perspective behind it, understand why I took this trade. Let me know if you guys would have taken this trade. Let me know if you guys, um, think it was a bad trade. If you think it was a bad trade, let me know in the comments down below and I'll block you or something, you know. We'll have fun about it, you know what I'm saying. But if you enjoyed the video, Smash the like button, subscribe if you're not subscribed already, and hit the post notification bell so you— talking to you— can be notified whenever I drop these gems, because you're gonna want to be notified. And also, if you want to learn how to do this for yourself, learn how to read charts, if you know nothing about charts, know nothing about nothing, CryptFi Academy can take you from step 1 to step 1 billion, you know what I'm saying? It's the first thing inside my description, or go to cryptfiacademy.com and join all the students that are in there learning so much and being able to create value just from being able to trade. It's absolutely freaking amazing. It's the freedom that you have from being able to do it wherever you want to do it, however you want to do it, when you want to do it, without nobody telling you what the heck you could do, because trading is a solo sport. But that's really about it. Make sure y'all go and follow me on Instagram over there, @juver_, DM me, let's be friends. Don't ask me for money, but that's really about it. Good luck on all your trades, good luck on your crypto. Good luck on your proposal that's coming up soon. I know, I know, James, Jimmy, John. Good luck on life as a whole, man, and I'm gonna see you on the next video.










