My Incredibly Easy Strategy That Makes Me $600/Day (Backtested Results)
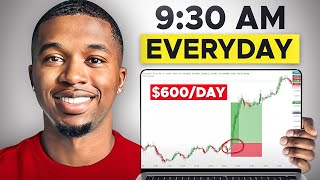
Josiah Stewart shows a market-open scalping strategy for E-mini Dow futures that marks swing levels at 8:29 AM, then enters on the 9:30 candlestick with a 10-tick stop and 30-tick target. A backtest of April 2025 turned $2,000 into $5,600 with a 70% win rate over 10 trades.
Chapters
In this video, I'm going to show you my incredibly easy strategy that has been proven to make $600 a day. If you often feel unsure on when to enter and exit trades, or you feel overwhelmed by complicated indicators, or feel like you spend hours and hours watching the charts, then this strategy is for you. And that's because it's so simple and easy that you can literally master this strategy in one weekend. One of my students literally passed a $100,000 challenge using just this this setup, and another one just made over $7,000 today after switching to this strategy. And then later on in this video, I'm going to take you through a full month of backtesting to show you real results. I'm talking about profit and loss, exactly how much you would have made, your exact risk-reward ratio that you would have gotten if you had used this strategy. Let's get straight into it. First of all, what makes this strategy so powerful? You don't need indicators. There's no guessing. It's completely systematic, which means that you have super clear exit and entry signals. And the best part is you don't have to sit in front of your screen all day. The setup literally happens at the same time every single day. It also has a huge risk to reward ratio. So your winners hit hard and it's okay if you lose one trade. And honestly, as I mentioned before, one of the best things is that it's so simple. You can literally master this entire strategy in just one weekend. Let's break it down. So here we are on the charts. As you can see, we have a simple checklist for this strategy with a set of rules. If you follow this checklist to the T without skipping any one of them, This strategy will absolutely print you money. So first of all, what is this strategy? This strategy is a market open breakout strategy on YM. This is specifically tested on the futures contract YM, and you're always going to hit a 3:1 risk-reward ratio. This strategy, as you guys are going to see later on inside this video, has an insanely high win rate with a 3:1 risk-reward ratio, which makes this an extremely profitable strategy. So let's hop into these rules really quickly. So first off, this is only to be traded on YM. This is not tested on ES, on NQ, on US30, on any of these other things. It's specifically tested on YM, the futures contract YM. The next step is to mark up the recent swing highs or the recent swing lows on the 1-minute timeframe. And you want to do that at exactly 8:29 AM Eastern Standard Time, because remember, this is a breakout strategy at market open. Market open happens at 9:30 Eastern Standard Time. So we want to mark up our highs our lows a minute before that. Now you might think that that takes a lot of time. I promise you, it is very, very simple. I'm going to show you guys the fastest way to do it to make sure you're able to do this within the 1 minute that you need. Now, the next thing you're going to want to do is set stop limit orders at these recent highs or recent lows. Now, stop limit orders are simply orders in the market that tell us and show us when price breaks above a certain place. If we're looking for buys, if price breaks above here, automatically get us into the trade. Because sometimes this setup will go too fast for you to use a market execution. And market execution simply means that you're hopping in where price is at. But if you wait to do it manually, you could sometimes not get in where you actually want to get in at, because you could be too slow. You could get in up here, you can get in up here, versus if you use a stop order, you're going to get in right where price— right where you put your stop limit order at. So that's what we want. We want to automatically be entered into the trade when price breaks below or above a recent high or recent swing low. We're going to go over a bunch of examples here in a second. Now, the next rule here is that we are going to have a stop loss of 10 ticks every single time. So when you're setting up your trade, and I'll show you exactly how to do this, you want to set it so it automatically gives you a stop loss of 10 ticks. This is a scalping strategy. We're going to be in and out of this most of the time within a couple of seconds of market open, which is what we want. We want to get in and out the markets and not have to sit here for multiple hours in the day to make our money. So like I said, stop loss is going to be 10 ticks and our take profit is going to be 30 ticks. So as you can see here, we're risking 10 ticks to make 30 ticks, which clearly shows us that we're going to have a 3:1 risk to reward ratio for every single trade that we take. So let's say we risk $100 every single trade. We're going to make $300 every single trade that we take, because like I said, we have a 3:1 risk to reward ratio. Now, we're only going to enter on the 9:30 candlestick. What I mean by this is, remember, we're marking up our zones, our swing highs and our swing lows at 8:29. If that 8:30 candlestick comes and it doesn't go above our recent swing high or below our recent swing low on that 8:30 candlestick and it goes to 8:31, we do not trade it. That is a no-trade day. You have to be okay with that. Like I said, you have to follow this trading plan and these rules down to a T. You don't want to enter on a 9:31 candlestick. That will not work. That is not tested. You only want to enter on the 9:30 candlestick, but you have to be aware to not enter on the 9:29 candlestick. So if the 9:29 candlestick breaks a recent swing low or swing high, let's say you draw your recent swing low or recent swing high at 9:29, and then it breaks that during that candlestick, that trade is invalid. You do not trade. You wait for the next day. The setup happens once per day. As you know, we're waiting for that breakout of the market open, and obviously market open only happens one time a day. So that's the rules. If you follow this checklist, you will be able to print money with this strategy with really 2 minutes of your time out of a day. 2 minutes of your day could pay you $600 every single day. And honestly, if you have more capital, you can make a lot more than $600 a day with this. But let's hop into some examples and show you guys exactly what this strategy is. This right here is actually a setup that a student of mine had taken. I did not personally take this setup right here. This student of mine is actually inside of my Inner Circle. My Inner Circle is where I trade live every single day. I teach you guys how to trade exactly how I trade. I have 4 other profitable coaches in there. We have a dedicated trading psychologist. You basically have everything that you would need to become a profitable trader. I'll leave a link for it inside the description down below. But basically, as you see right now, this big red candlestick. This is that 8:30. I'm on Central Standard Time right now. I can go to Eastern Time right now. If you look in the bottom of my screen right here, you see Wednesday, 30th April 2025 at 9:30 AM. This is that 9:30 candlestick. This is the candlestick we would enter on. This is the 8:29 candlestick. This is that 8:28 candlestick. So imagine we don't see anything before this. We can actually go on the replay feature right here. So this is what we're seeing at 9:29. At 9:29, we want to mark out our recent swing low. This is a recent swing low right here because it's the lowest that price went, then it went up. In this instance, we don't have a recent swing high because this 8:29 candlestick— because originally this was our swing high. You see, we were going up, we came down. This is our recent swing high. But as you can see, the 9:29 candlestick broke out of this— 9:29 Central Standard or Eastern Standard Time, sorry. So we couldn't look for buys because remember in our rules If the 9:29 candlestick breaks our recent swing high or recent swing low, the trade is invalid. But the 9:29 candlestick did not break our recent swing low. So if price did sell down here at 9:30, which we know the next candlestick is going to sell down, we can still take sells. We just couldn't take buys because our swing high got invalidated. Now you might ask me, how do you see swing highs? How do you see swing lows? And a simple way of seeing it and realizing what it is, we all know the market does never just go straight up or straight down. Market goes up, down, up, down, up, down, up, down, up, down, up, down. That's what the market does. This is a swing high. This is a swing low. This is a swing high. This is a swing low. This is a swing high. This is a swing low. Swing high, swing low, swing high, swing low. All it really means when I say swing high or swing low is price had went up, made a swing high, and then started going down. And then started going up again, started going down, up again, down again. That's all swing highs and swing lows are. So what that looks like on the charts— let me delete all this— and it's good for you to practice this, and we'll get into how you can actually practice this to be able to spot it. All that looks like on the charts is we see price was down here, price came up, then we started going down, then we started going up, then we started going down, then we went up again. So you see in this instance we have a swing high right here. We have a swing low down here. We have a swing high up here. We have another swing low right here. So looking at this, we can easily see a swing high up here at the top of this candlestick before we sold down. Then we have a swing low right here at the bottom of this candlestick before we went up. We're doing this based off of the wicks, not the bodies. Um, so once we have that, then we're going to put our sell stop order right here. Remember, we're setting these automatic entries so that we're able to actually enter into the trade automatically without having to do it manually, which would cause us to get too bad of an entry. So set our stop limit here, and if we're looking for buys as well, we set our stop limit up here. But since we're not looking for buys, we wouldn't do that. We set our, our stop sell limit right here, and as you see, the next candlestick sold down entered us into the trade right here, continued to flush to the downside, and we would have made our 3:1 risk-to-reward ratio, our 30 ticks right here. Now this is one example. I have multiple examples here. That's April 30th. We have this example right here where you see we had price go up, down, up, down, up, down. These are all swing highs and swing lows, right? So this area right here was a recent swing high. This area right here was a recent swing low. So all we have— we would have wanted price to do was break this swing high right here. And I can show you guys this in real time— was break this recent swing high because this is that 9:29 candlestick. Remember, that's where we're drawing our lines at. So when I'm looking at this, I'm simply just going to plot out, okay, this is the recent swing high. And this technically isn't the recent swing low because we didn't have price reject off of here yet. The recent swing low would have been right down here because, as you see, we're going down but we haven't started that ascension back up, right? So the recent swing low would have actually been right here because we had went up and we came down to this point right here. So this is where I would have had my sell stop order right here, and I would have had my buy stop order up here. And whichever one gets me into the trade at that 9:30 candlestick, that's the way I'm going. I'm not going to take both directions. So let's say it buys up, enters me into the trade here, and I win it. And then it sells down, enters me into the trade. I don't do that. I'm only taking the first direction that it breaks in. So, um, obviously we have our swing high and swing low plotted out. Next candlestick would have automatically entered us into the trade here. Hit our 30-tick take profit, our 3:1 risk-to-reward ratio, and we would have instantly made money within a couple of seconds. Let me show you guys some more examples. I have a bunch of these examples. This is the day where we had no trade, and I'll break down exactly why we had no trade. So in this instance, this is, um, the 8:29 candlestick right here, right? And this is that 8:30 candlestick. So when we're looking at this, we know this is our recent swing high up here. Right, our recent swing low was broken by this 9:29 candlestick because technically this would have been a recent swing low, or maybe this would have been a recent swing low. We really didn't have a clear recent swing low on this, so we would only been looking for buys. This white candlestick is our 9:30 candlestick, but as you see, it didn't— it never broke above our recent swing high, and we're not going to enter on that 8— on that 9:31 candlestick. We're only going to enter on that 9:30 candlestick. So hence the reason this is a no-trade day. So be aware of those times because it does happen. You'll see a couple of those examples here. So again, we have another trade right here where we have, uh, a recent swing high is up here. We broke above it on this 9:30 candlestick, instantly tapped us into it because we use a stop order, and we hit our 3:1 risk-to-reward ratio, and we made our money and walked off and had a great rest of the day. And I have a bunch of these examples. I just wanted to make sure you guys clearly understand exactly what we're looking for. Again, here's another example. We had price go up, down, create a swing low right here. If I rewind this, you guys can't, uh, see it. So we had our recent swing low right here, and then we also had a recent swing high created up here. So if price had broken here, this is that 9:29 candlestick. This is the time where we'd be plotting out our, um, recent swing highs and recent swing lows. So we have the recent swing high up here, recent swing low right down here. We'd wait for price to break below here or above here. Fast forward, and as you see, price broke to the downside. We would have made money. Obviously, we could have held this trade longer, but we're not here to be greedy. We're here to make our money, our $600, our $900, our $1,000, whatever it is for you, and get out. In and out in a couple of seconds. So as you can see, this strategy is extremely simple. It's extremely repeatable because it's just following a checklist at the same time each and every day, and it's honestly super stress-free because you don't have to think about anything. The most you have to think about is putting these lines on your chart, and realistically, you don't have to think about that much at all. Once you have these— the swing high and the swing low— you're on your chart, you put your entry, and you just wait. Once that 9:30 candlestick comes, you'll be in and out the trade within a couple of seconds, and you'll be good. In the entire back-tested results— we'll go over those in a second— there's not a single time where it took more than 30 seconds to hit our take profit, not a single time. And that's throughout an entire month. This happens month after month, week after week. So now that you know what this strategy is, we're going to get into the backtested results. But first, I do strongly suggest that you actually backtest this for yourself. Don't just watch me or watch other people do it. Actually go and test it for yourself to see how profitable it is week after week and month after month. Backtesting it is also going to help you be super, super confident when you're drawing your swing highs and swing lows, which is probably the hardest part of it. And that's not even hard at all. But with that being said, let's actually hop into the results that you would have had if you used only this strategy for an entire month. It's going to blow your mind. Okay, so here we are on FX Replay. I personally like backtesting on FX Replay just due to the fact that it helps you track all of your analytics very, very easily. I'm not sponsored by them or anything, it's just usually where I do my backtesting on. So here, just off rip, I just want to set the, the tone so you guys understand exactly what we're looking at here. This is me starting with a $2,000 account and simply using 4 contracts for each and every trade. So I didn't switch up the amount of money I was risking. I was risking $200 every single trade, and I was risking that $200 to make $600 every single trade. So as you see here, we started with $2,000 in our account at the beginning of one month and we were able to profit $3,600 with a small account of $2,000. That's absolutely amazing. So at the end of the month, we obviously had an account balance of $5,600 because we made that profit of $3,600. We had a 70% win rate and we ended up taking 10 trades in total. As I mentioned, sometimes the setup doesn't happen, which is perfectly fine. We just go on to the next day. We don't force any trades at all. So this, the 70% win rate, we had an average risk-reward ratio of 3. We're always going for 3 risk-to-reward ratio. This right here actually tells us that we could have held trades a lot longer. When we see the ideal average risk-to-reward, we could actually technically on average hold this trade a lot longer to have a 25:1 risk-to-reward ratio. But like I said, we're not trying to get greedy. We want to get in and out and get our money. But that's where backtesting actually shows you, uh, ways that you can optimize your strategy. And that's why I suggest for you guys to backtest for yourself. Because you might say, okay, I can go for a 3:1 risk-to-reward ratio, but sometimes if I see this, this, and this, I can hold it for a 5:1 or 6:1 risk-to-reward ratio and make even more money. But that's when you go deep diving into backtesting. As you see here, we had 7 total winners and total losers. We had 3 total winners. We actually had an average of 2.33 consecutive wins, which basically means that on average we won 2 days in a row and then we lost 1. That's usually how it goes on this. Um, like I said, I love this website because it breaks down all this data for you. You'll be able to see all your trades here. We took 50% buys and 50% sells. Um, our win rate, we actually had a higher win rate when we bought versus when we sold, um, or entered sell positions. Um, you can see this is all done inside the New York session because it's all done at the same exact time. You can see your metrics by day. I don't really track this too much when it comes to this strategy. Simply due to the fact that it happens every single day at the same exact time. So I'm not worried about if it's Monday, Tuesday, Wednesday, Thursday, Friday. You can see here on the calendar, we were making $600, $600, and we lost $200. We're only taking one trade every single day, as you see here, which goes to show you that we're not trying to be greedy. We're not entering on buys and then entering on sells. That's not what we wanna do. If we win the trade, walk away happy with our money. If we lose the trade, walk away happy with our loss, knowing that we're going to make the money back tomorrow.. And with this being a 3:1 risk-reward ratio strategy, you can lose 3 trades in a row. And if you win 1 trade, you made all of your money back, which is absolutely amazing. And it having such a high win rate of 70%, that is absolutely beautiful. Now, a cool thing that you see down here is FX Replay actually gives you a simulation. So this is based off of all the stats that we just went over when it came to this strategy. It gives you a simulation if you use this same exact strategy and let's say you started off with $2,000 in your account and you were always going for that 3:1 risk-to-reward ratio. Like I said, in this back-tested results of just this month of April, I risked just $200 on each trade. And the reason I did that is starting off with a $2,000 account, in order to open up 4 contracts of YM, you need $2,000 in your account. Obviously, you can open up 2 contracts on YM and you would have been risking $100 every single trade to make $300 every single trade. You could also have technically had $10,000 in your account and opened up 10 contracts every single trade and been risking $500 to make $1,500 every single trade. But in this example, as I told you guys, I was just using this on a small $2,000 account, risking $200 per trade, which comes out to 10% of your account per trade, to then make $600 per trade. But if we kept those same exact numbers as far as the win rate that we had with our average gain, our average loss, you can see over the course of 100 trades, we would have actually profited our account to get to $39,000. So that's after 100 days of trading, we could have turned $2,000 into $39,000. Now obviously this can get super, super crazy if we start off with a $10,000 account and we're risking, let's say, like I said, $500 per trade to make our 3:1. Risk to reward ratio, which is $1,500, keeping that same 70% win rate. We can hit start simulation, and we've turned our $10,000 account into $106,000. Uh, simple as that. Now keep in mind, this is not solidified. It's just a simulation, just takes the numbers and the profit targets and our risk to reward ratio to project what potentially could happen. But like I said, backtest it for yourself. You're gonna— you're going to get very, very similar results as far as the win rate and how much profit you're going to make. It's an absolute killer of a strategy, and it's been able to help a lot of people not just pass funded accounts, but make hundreds, if not thousands of dollars every single week with really only 2 minutes a day of work, which is obviously pretty good. Now I trade this exact strategy live with my inner circle students. And as I said before, one of them used this strategy to pass a $100,000 prop firm challenge and someone else made over $7,000 in one day. And honestly, countless of other people are profiting daily with it. So if you're serious about trading and want to be able to consistently make over 5 figures every single month with trading, I highly suggest you join my inner circle. What's included is you get to trade live with me every single day. You get to learn how to trade exactly how I trade. You get to actually take the same exact setups that I take every single day. You get to ask me questions in real time live every single morning. You have access to 4 other extremely profitable coaches. We have a dedicated trading psychologist. You've probably heard this 100 times, that psychology is the hardest part of trading. So I needed to get a trading psychologist inside of my Inner Circle, and I have one for you guys to help you master your trading psychology. There's so much more that's included in my Inner Circle. It's literally the exact thing that I wish I had when I first started off trading. If I had my Inner Circle back when I first started off trading, I would have skipped so many losses. I would have made so much more money in a shorter amount of time. But being honest with you, my inner circle is extremely limited. Spots are literally always full. If you check the comments in any of my YouTube videos, it's always going to be people saying, please open up more spots. But since you've watched this video, I can tell that you are serious about trading. So I want to open up some spots specifically for you. Click the link in the description down below to have the opportunity to join my inner circle and be able to accelerate your journey to profitability. Now you've got the exact strategy and system that's proven to make $600 a day. But here's the thing, this is just one setup. And if you're serious about making multiple 5 figures every single month, you'll want to watch this video right here where I teach you how to master my 1-minute scalping strategy that is proven and tested to make $11,870 a month with just a few minutes a day. I'll see you there.










