Stop Using Candlestick Charts. Use These Instead
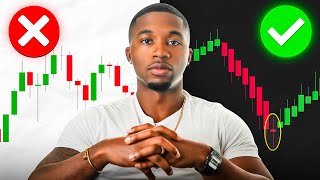
Candlestick charts create noise that leads to bad entries. Heikin-Ashi candles smooth the price action by plotting each body at the previous candle's midpoint, revealing clearer trends and support zones. Three patterns signal reversals and breakouts: doji-like candles, candles with no bottom wick, and candles with no top wick.
Chapters
If you constantly feel like you're getting faked out, second-guessing your trades, or have no idea where price is going next, chances are regular candlesticks are making things harder than they need to be. So that being said, if you're still using regular candlesticks, you're trading on hard mode. So in this video, I'm going to show you guys what I use and how it instantly made it very easy to lock in consistent profits like this, like this, and like this as soon as I ditched regular candlesticks. Regular candlesticks are holding you back because honestly, they just have too much noise. They show you every little wick, every little small price movement, which throws you off and makes trading way more complicated than it needs to be. It gives all these false signals causing you to second-guess every one of your trades, second-guess all of your entries, just making you a very inconsistent trader because you can't even trust the chart that you're looking at because it looks like craziness. Now candlestick patterns in theory sound very good, but in real time when you're actually trading it, they're very inconsistent and they're not something that you can feel confident to depend on. And that's the main reason why you're hesitating on your trades, hesitating on your entries, being super, super confused and not confident in trading, period. And that's why you really should ditch 'em and start doing what I do. Now, what I use is Heikin-Ashi candlesticks, which is a much better version of the traditional candlesticks that you're used to. So let's go into a chart and I'll show you guys how to turn on Heikin-Ashi candlesticks, how to use them, how to understand them, and how it turns your choppy mess of a chart instantly into a very, very easy-to-read chart that you can actually trust. All right, so here we are on TradingView. If you don't know what TradingView is, it's where 99% of traders actually look at their charts and mark up their charts, uh, plan out their trades. So if you come up here on the top part of your screen, you've probably seen this candlestick icon, but if you hit the dropdown next to it, you can actually choose a bunch of different charts. You could choose the line chart, area chart, columns, Footprints, line with markers. But this is the holy grail right here, the Heikin-Ashi candlestick chart. If you press that, I want you guys to watch and see how our chart changes as soon as I press it. Now you see price is a lot more smoothed out. You see this is a lot more readable, a lot more easy to understand. Well, way more easy to understand and actually feel confident in what you are looking at. Now let's break down what these candlesticks mean. So we know on regular candlesticks If we look at a candlestick, this is the body of the candlestick, then we have the wick. We have all different shapes and sizes— big bodies, big wicks, small wicks on the top, small wicks on the bottom, big wicks on the bottom. It just varies depending on what candlestick you're looking at. Now when it comes to regular candlesticks, like for instance this candlestick right here, the top of a bullish candlestick— bullish just simply means price is going up— The top of the bullish candlestick is where price ended at, the bottom is where price started at, and the wicks is where price has been throughout the time. Same thing when it comes with a bearish candlestick. The top of the bearish candlestick is where price started at, the bottom is where price ended at, and the wicks is where price has been throughout that candlestick. That's how regular candlesticks work, but Heikin-Ashi candlesticks is slightly different, and let me break it down for you. So we switch right back over here to our Heikin-Ashi candlesticks. And as you see, this looks a little bit different. Looks a lot smoother, a lot more digestible. But if you haven't seen Heikin-Ashi candlesticks before, you might be confused on how they work because you see some of these bodies start in the middle of them. Well, sorry, every single candlestick starts in the middle of the candlestick before it. And that's how Heikin-Ashi candlesticks work. We're not worried about the bottom of the body of a Heikin-Ashi candlestick because the bottom of the body of a Heikin-Ashi candlestick is, um, always starts at the middle of the candlestick before it. So that doesn't really tell us much about price. What we're concerned about are the wicks and the top of the body on a bullish candlestick, which means a candlestick that's going up, which yours automatically might be green. Mine are red here. Actually, let's change this to green so, uh, it's very easy for you guys to understand. So as I was saying, with our bullish candlesticks, which is our green candlesticks, the body of the Heikin-Ashi, the bottom of the body of the Heikin-Ashi always just starts in the middle of the candlestick before it. The same thing with a bearish one. So the body, the top of the body of the Heikin-Ashi candlestick that's bearish, this red one right here, always starts in the middle of it. We're not too concerned about that. We're worried about the, the wick and the body that's attached to the wick. So the body, the top of a bullish candlestick body, that's the average of where price has been throughout this candlestick. The wick works the same. The wick is where price has been throughout the candlestick. You'll see some of these have wicks on the top or the bottom. That simply means that throughout this entire candlestick— right now we're on the 1-minute time frame— so throughout this entire 1-minute period, price has been up here, it's been here, it's been here, it's been here, it's been here, it's been all throughout this candlestick. Um, so it works the exact same. But when it comes to a candlestick that looks like this, that means price could have been anywhere in this area, but it did not— price never went below the body because we don't have a wick on the bottom of the body of this candlestick. Now there are multiple benefits when it comes to Heikin-Ashi candlesticks, and the main one that I personally love is because the body— as I told you guys, the top of a bullish candlestick body shows us where price has been on average during this 1-minute time frame. Same thing vice versa with bearish candlesticks. So the body right here tells us the price of the average of where price has been throughout this candlestick. Now like I said, we're on the 1-minute time frame. Works the same for on the 5-minute, 15, hourly, daily— it doesn't matter. The body is going to show us the average of where price has been. When you see the candlestick close right here that's not where price closed at. Price could have closed anywhere inside of this zone. Now what I suggest for you to do is actually right-click on your screen, go to Settings, and make sure right here is unclicked the Real Prices on Price Scale. Make sure that's unclicked because what that does, if you have it clicked, you won't see where price is at. Now when I unclick this check mark right here, I want you guys to pay attention over here. You'll see that two of these will pop up, two of these numbers will pop up. So this one up here with the countdown under it is— that's just the average where price has been. But this one right here is where price is actually at. As you see, as price is going down, this number is going down. This is telling us where price is actually at. So when you are using Heikin-Ashi, you want to pay attention to this second number so you see exactly where price is at throughout that candlestick. Don't get confused with regular candlesticks thinking that the body is where price is actually at. That's just the average of where price has been throughout this entire candlestick. So that's why I suggest for you guys to have this unclicked on your settings. Now, as I mentioned, being able to see the average where price has been throughout the entirety of a candlestick is extremely beneficial no matter what strategy you're using. If you're trading breakouts, you know on average price has held above your breakout zone. If you're trading support or resistance, you know on average price has rejected that support or resistance zone that you have. If you're trading trendline breaks, you know, on average, the candlestick price has been outside of your trendline, which gives you confidence in your entries and confidence holding your trades. Because as you notice, if we actually switch to regular candlesticks and look at this rally to the upside here, where we see price is going up on Heikin-Ashi candlesticks, this looks very smooth. If we switch to regular candlesticks and go to that same period, we see we have a lot of hesitation here. We have a lot of different candlestick color changes If you were holding buys here, let's say you bought right here and you were planning on holding this the entire way up, you could have gotten scared right here. You could have gotten scared over here. You could have gotten scared over here. You could have gotten scared in all these places where price, or with regular candlesticks, it looks very, very confusing and almost as if price is trying to come back down to go against you. But if you're using regular candlesticks, we see we're making one fluid motion with a small pullback here to the upside. We didn't see any of the noise and confusion that happened during this period, the barely any of the noise confusion that happened in this period, which like I said gives us much more confidence when we're actually holding our trades. So that's why I said in the beginning of this video, instantly switching to Heikin-Ashi candlesticks can make you way more money because it'll give you the confidence to hold your trades much longer, seeing the bigger picture, seeing that we're overall going up. Versus you seeing all of these small little retracements to the downside or small little candlestick color changes that look like they might be going against you, which could scare you into closing your trade out early, cause you to miss out on all the potential to make way more money. Now with that, you being able to see this clean price action in one direction also helps you be able to understand the trend and see the trend a lot better. You're able to see these lows much better. You're able to see these highs much better. You're able to see the higher highs, the higher lows, the higher highs again, the higher lows. All these things are much easier to see versus if you were on regular candlesticks, and you'd probably get super, super confused on what are real higher highs or what are real higher lows. Should this be the higher high? Should this have been the higher high? You would get super confused on regular candlesticks because they are so choppy and because they are all over the place. That's why having Heikin-Ashi candlesticks helps you easily see the trend, easily be able to identify when we are in an uptrend or if we are in a downtrend, or if we are in an uptrend over here, or if we're in a downtrend right here. It very, very much simplifies an overcomplicated chart. And that's one of the huge benefits that not only myself, but also every single other person of mine that I I've taught this to has been able to get a huge benefit from it. If we zoom out right here, we can actually clearly see our support or our resistance levels because they just stand out much easier with Heikin-Ashi candlesticks. As you see right here, we have an easy-to-see double top. We have an easy key level right here. We have an easy key level right down here. We can see all these very, very plainly and easily simply because Heikin-Ashi candlesticks remove all the noise. So it helps you not have to second-guess any of your key levels, any of your trend lines that you're drawing, because you can clearly see— let's see, right here we have a touch, right here we have another touch, right here another touch, right here we can clearly see all of this when we're using Heikin-Ashi candlesticks, just due to the fact that we're seeing the simplified version of the charts, the cleaner version of the charts, versus being on regular candlesticks. This is another huge benefit of Heikin-Ashi candlesticks because it helps you not pay attention to the bad support or resistance zones. Because a lot of times traders can come into the charts, look at their charts, and they're trading based off of areas that are not even support or resistance zones, and then they're taking trades off of it and losing. And this has probably happened to you before where you feel like price went to your pre-planned support or resistance zone, it went up to it, and and it just did nothing. It didn't respect it at all, and you doubt yourself as a trader. You doubt your entries, you doubt, um, everything when it comes to your trading, all due to the fact that you couldn't clearly see what is a true support or a true resistance zone or even a true key level or a true trend line as we drew right here. So turning on Heikin-Ashi Candlesticks instantly, like, clears your eyes so you can very, very, very clearly spot and see every single key level, every single correct support and resistance, and be able to mark out trend lines and see them very, very accurately. Now, those are some of the key benefits when it comes to trading Heikin-Ashi. But as you know, the candlesticks are a little bit different, so we have different candlestick patterns. And Heikin-Ashi candlesticks easily point us out when we should actually enter into trades or get out of trades. So let's go into what those patterns look like and what each Heikin-Ashi means, because there's a story behind each candlestick. I'm going to break down what each one of those candlesticks means for you, so when you see these candlesticks, you know exactly what to expect next. So when we see a candlestick, let's say this is our key level, right? Let's say we drew a key level right here and we want to know when we should buy, right? Let's say price is coming down into our key level. We want to know when should we enter, when should we actually buy into this trade to actually make money on this trade. If you see a Heikin-Ashi candlestick that looks like this right here, where it has a small skinny body but wicks on the top or the bottom, preferably long wicks on the top or the bottom, the top and the bottom, that are very, very equal— they don't have to be completely equal but are close to equal size as possible— this is a reversal indicator. This is telling us that whatever direction it's been going in, it's most likely about to reverse and go in in the other direction. So if we see price coming down into our, let's say, key level, our support or resistance zone, and then we see a doji candlestick that looks like this— small body with long wicks on the top or the bottom— we know we can probably enter for a buy at this area and make money because price is probably about to reverse off of our key level or our support or resistance zone. This is one example of it right here where we got a doji. We're going down, got a doji, and price started going up.. But right after that, you see price actually started going up, and then we got a doji. And what did price do next? Price started going down. We can see a bunch of these examples on the charts. We had price going down, we got a doji candlestick, price started going up. We had price going up, we got a doji candlestick, price started going down. As you see, this happens multiple different times on the charts. You can just scroll through on Heikin-Ashi candlesticks and be able to see multiple examples of this. Price was going down, got a doji candlestick, price started going up, got a doji candlestick, price started going down. So we see these doji candlesticks, that's a sign of reversal. So remember that small body with long wicks on the top or the bottom, preferably, preferably equal size, um, on the top and the bottom. That means, and that indicates, that price is probably about to reverse. Now when we see candlesticks with no wicks on the bottom That means that there's strong volume to the upside. If we see candlesticks that have no wicks on the top, that means that there's strong volume to the downside. And usually what follows these no wick on the bottom or no wick on the top Heikin-Ashi candlesticks is a candlestick that goes in the same direction. So as you see, we got a candlestick right here that had no wick on the top. Then we had another one, then another one, then another one. That just signifies and shows us that there's volume to the downside. Now obviously when we start seeing candlesticks that then have wicks on the top or the bottom, even if it's not a doji like this one, we know price is starting to slow down. There's not as much volume in that same direction, so it's probably going to end up going in the opposite direction. But we can feel confident if we get a doji candlestick— sorry, if we get a Heikin-Ashi candlestick. Let's say we're looking for buys. Let's say this is our area and we have price coming down into our area and we want to know When should we enter for a buy? If we see price coming to our area and then we see a Heikin-Ashi candlestick with no wick on the bottom showing us that this is their strong volume for buys, that could be a great indication for us to actually hop into a trade for a buy. And then obviously vice versa. So if we see prices coming up into a resistance zone of ours and we're waiting for price to sell down, we want to hop in a sell. We can simply just wait for price to tap into our zone, give us either a doji candlestick or a flat top Heikin-Ashi candlestick that shows us that there's a lot of selling volume, and we can hop in once we get that no wick on the top, um, Heikin-Ashi candlestick. And as you see, price continued to go to the downside. Those are the 3 main candlestick patterns that you need to pay attention to and would— what will basically tell you the exact story of what price is most likely going to to do next when it comes to Heikin-Ashi. So just remember the doji and remember this— the Heikin-Ashi candlesticks that have no wicks on the top, or the Heikin-Ashi candlesticks that have no wicks on the bottom. Now I've used Heikin-Ashi candlestick, as I mentioned to you guys earlier in this video, to boost my win rate and boost my profitability when it comes to every single strategy that I use. No matter if I'm trading a breakout, no matter if I'm trading support or resistance, no matter if I'm trading trend lines, supply and demand, no matter what it is, I've instantly increased my win rate as well as my profitability simply by using and understanding Heikin-Ashi candlesticks. And that's why I had to put you guys on, and I had to educate you guys on what Heikin-Ashi candlesticks are so you can start implementing them into your trading. Now, the reason why they're so beneficial— I'm going to give you guys a couple of examples so you guys see exactly what's happening. So if you're a breakout trader Most of the time when it comes to breakouts, we're looking for breakouts of previous supports or previous resistance. But there is something called fakeouts, which simply means that— let's say for example we're looking for a breakout below here, right? We're looking for price to break below what we can see here is an obvious support zone. We want price to then come and sell down, and we are planning to sell and make money when price sells down. We're looking for a breakout of this support zone. With regular candlesticks, we see it broke out right here. We would have probably gotten in right here, and price would have faked us out and continued going to the upside. But the thing I told you guys is that the body of the candlestick shows us the average of where price has been. So we know not either one of these candlesticks has averaged outside of our breakout zone, so we wouldn't have taken this. Using Heikin-Ashi candlesticks would have saved us from getting faked out. It's one of the most powerful things that you can actually use to prevent yourself from getting faked out, because as I said 100 times, the body is the average. And when it comes to breakouts, if we're waiting for the average of where price has been throughout that candlestick to actually have broken out of our breakout zone, that's giving us confidence that because on average it stayed out of our breakout zone, it's probably going to continue out of our breakout zone, which eliminates a lot of the times where we could potentially get faked out. That's one way it can benefit you if you are a breakout trader. Now let's say you are a support or resistance trader. Most of the time you could get tricked into hopping into trades early or not feeling confident in your entries. When it comes to Heikin-Ashi candlesticks, we know if we wait for any of those 3 candlestick patterns that I showed you guys to enter into the trades, whether it's the doji or the no wick on the top or no wick on the bottom Heikin-Ashi candlesticks, we can be certain with our entry criteria because we know on average price is doing the reversal of what we want, where price was potentially going. So what I mean by that is, let's say this was our support zone down here, price came down into our support zone, and then we got a Heikin-Ashi candlestick that shows us on average the price is rejecting off this zone. That gives us confidence to actually enter our trade as price is rejecting, so we can make money on that rejection to the upside or to the downside, no matter where we're going on. Now, it's the same thing when it comes to trendline breaks. If we're looking for breaks out of trendlines, we know we can wait for price to— for our Heikin-Ashi candlesticks to break out of that trendline. So it shows us that the average where price has been is outside that trendline, causing us not to get faked out by trendline breaks as well. If we're trading supply and demand bounces, we We know we can use Heikin-Ashi to know when we should actually enter into the trade if we see that doji, or if we see those high-volume Heikin-Ashi candlesticks with no wicks on the top or the bottom. There's so many ways that you can implement Heikin-Ashi candlesticks instantly into your trading to give yourself a lot more clarity when you're hopping into trades and a lot more certainty so you don't get faked out. You feel more confident when you're entering into your trades, and you feel more confident with the actual areas of interest that you have, whether it's support zone, resistance zone, trend line, supply and demand zone, does not matter. Now I've altered each and every one of my strategies to work perfectly with Heiken Ashi candlesticks. So if you want to get access to every single one of my strategies that have been optimized to work perfectly with Heiken Ashi candlesticks, that has drastically increased their win rate as well as their profitability, I'll leave a link for it inside the description down below so you guys can get access to full in-depth courses and guides on how to use the same systems and strategies that I use when it comes to Heikin-Ashi that has allowed me to be able to generate crazy amounts of profits as you see on the screen right now. So like I said, if you want that, hit the link inside the description down below. Now don't just switch to Heikin-Ashi candlesticks and just start praying and hoping that it's going to work out for you. Test this, test exactly what I'm saying. Don't just take my word for it just because I might have a couple thousand subscribers on Instagram or YouTube or whatever. Test this stuff for yourself and implement it into your trading. Now, how I suggest for you to test it is through backtesting. There's a feature on TradingView that actually allows you to backtest. If we come over here on Heikin-Ashi candlesticks though, you'll notice that if we try and hit that replay button, which allows us to backtest, it shows us that bar replay isn't available for this chart type. I don't know why TradingView does that. There's actually a website that you can use called fxreplay.com, which lets you backtest with Heikin-Ashi candlesticks. But you don't have to do that because I have a workaround for you guys. So how I backtest when I want to backtest Heikin-Ashi candlesticks on TradingView is I'll hit regular candlesticks, and what I'll do is go to indicators and type in Heikin-Ashi candle overlay. You'll see it's by this person named Bjorgum, and you're going to press it. Once you press it, you'll see it actually overlays on top of your regular candlesticks. Now And what you want to do, because this looks crazy because you see the overlay as well as regular candlesticks, right-click on your chart, go to Settings, and unclick the body, the borders, and the wick. That way it turns off regular candlesticks. You don't see regular candlesticks. All you see is that, that indicator that we just put on. But to TradingView, you're still on regular candlesticks, so you can still use this replay feature right here. What the replay feature does, if you don't know, is it allows us to accurately backtest because with this red line— this blue line, sorry— when we hit the replay, if we press anywhere, let's say we press right here, it actually hides all the candlesticks before it— or after it, sorry. So you can hit this skip button right here and skip forward so you can actually practice trading without knowing what's actually going to happen, which is the only accurate way of practicing your trading. Now I have a whole video on how to backtest, but I just want to quickly run through how you should be backtesting because you want to come in here and practice drawing your support or resistance zones, seeing how easy it is to find your trend lines when you switch to Heikin-Ashi candlesticks. You want to practice doing all this when you're backtesting, but you also want to track your wins. You want to track your losses on your strategy. You want to track if you entered on a doji or you entered on one of the candlesticks that have no bottom or no top wick. You want to track all these things because it's super important when you're backtesting to have the data of your backtesting so you know exactly what you should change, where you should optimize, which you should get better on. Now you can do this manually just on a notebook or whatever, but a platform that I personally suggest and I use all the time because it basically helps you automate all of this is Wagmi. I'll leave a link for inside description down below. It's not only great for tracking your backtesting results, but it's what I use to actually journal every single one of my live trades as well. And it does it automatically, which saves me hours and hours of time. Like I said, I'll leave a link for it inside the description down below. It's literally the one I've used my entire trading career. So I'll leave a link for inside description down below. But that is how you actually backtest with Heikin-Ashi. Like I said, you just have to do that quick workaround with putting on that indicator and then dive into here. I want you guys to test out finding these dojis, test out finding your support or resistance trend lines, all the things that I mentioned, so you get comfortable trading Heikin-Ashi candlesticks. And then take it live and see how well it improves your trading, how drastically improves not just your win rate your confidence in the market, how stress-free trading becomes because you don't see all the different noise or different color candlesticks going against your trade. It just helps you be way more profitable, and it's really at the click of a button. Now, if you want a highly profitable Heikin-Ashi strategy with an extremely high win rate and real results to show you how to actually do this, I highly suggest you watch this video right here where I break down one of my favorite strategies to use trading Heikin-Ashi candlesticks. And how amazing the results would be with just 1 month. I'll see you in this video.










