The BEST Binary Options Trading Strategy 2021 *Very Profitable* (LIVE TRADING)
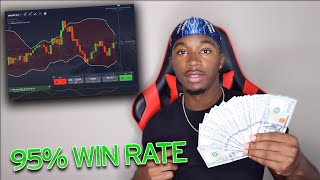
Josiah Stewart demonstrates a binary options strategy using Bollinger Bands (period 20, deviation 2) and Stochastic Oscillator (14, 3, 3) on 2-minute charts. Entry requires three confluences: price outside the bands, stochastic outside neutral zone, and a candlestick pattern like a wick-rejection or doji. He places a live demo trade that wins.
Chapters
What is goodie, my people? We are back again with another gem. I'm saying, hey, we spinna make some money today. I'm finna teach y'all, show y'all how y'all can make some great, outstanding, fantastic, absolutely amazing money by trading some binary options, HFX, whatever you want to call it. So if you guys did not watch the video I did a couple, uh, I feel like 2 weeks ago, I made a video, my first time ever trading binary options, my first time doing HFX trading. And since then I have established my own strategy. It's been very, very, very profitable for me, and today I'm going to share it with you guys. Now, a lot of you guys have asked me since that— since I put that video up if I'm still trading it, um, if I can show you guys my strategy, if I can help you guys get into it. So today I'm gonna teach y'all the best strategy I found. Now, if you did not watch that video, you need to go watch that video. It's literally right up there. Watch it before you watch this video. But in that video, I was kind of using other people's strategies. I was on YouTube, I was just like searching a bunch of different binary options traders, and I would just copy their strategies, test it out, see how it works. And overall, I ended up with a profit of, I think, $500, something like that, on my total account. But over the, the weeks of kind of playing around with it and messing around with HFX trading and binary options and everything like that, I established my own strategy that's been absolutely amazing for me. It's been super profitable, and today I'm going to share with you guys. So like the video right now if you're excited for more HFX trading videos, and, um, let's just get right into this. All right, so boom, this is what I trade on now, Pocket Option. Um, I actually I was trading on Pocket Option a little while ago and somebody was mad at me. There's like, when would you trade on that, man? Listen, I don't know, it just looks cool. I like the whole setup of it. I like the way I can have my charts and everything like that. But I'm gonna break down all my indicators here. I'm gonna break down the time frames, gonna break down the purchase time, everything here. Just give me a second, be patient. You're gonna learn how to make money. If you got $10, you got $20, $50, you got— you can make money from— I'm guaranteeing y'all. Now listen, I'm not a financial advisor. We're just friends. I'm just trying to help you make some moolah. You feel me? Now when I tell y'all this strategy, I want you guys to test it out for yourself. Obviously practice it on a demo account. Do not use your real money and never trade with money that you actually need because even though the strategy is good, sometimes you can get unlucky. Sometimes it just doesn't go your way. So if you're trading with money that you actually need, like your rent money, your mama's funeral money, your grandma's, um, cancer medication money, whatever it is, some real money, don't trade with that, my guy. Use the money that you got for your birthday, that $25 your grandma gave you, use that. And then flip that $25 to $100, then that $100 to $1 million, just like that. Skip $100 to $1 million, just like that. But if you look at this chart right now, first of all, I am on a demo account right now and I will explain to you guys why I'm on a demo account. Actually, I'll explain to you guys right now. So it's Saturday, right? I wanted to get this video out, but if you guys did not know, the markets are closed on Saturday. But what Pocket Options allows you to do is they have versions of the market, OTCs, which is basically over-the-counter. I don't trade when the market is closed and I don't trade OTCs because the brokers, aka Pocket Option, aka, um, the other— I forgot what other binary options, um, website I was using before— they can manipulate the market where OTC— excuse me, I'm about to sneeze, hold on. You better have said bless you, I promise you, you better have said it. If you didn't, I'm not gonna share that, I'm not gonna share the strategy with you. Say bless you, comment down below, bless you, man. But listen, like I was saying, they can manipulate the OTC trading— what am I saying— currencies. So that's why I don't trade on weekends, because these are the only ones that are available on weekends. But just to get this video out there, you guys have been asking for it, so I want to get it out for you guys right now. I might do a trade or two just to show you guys that it actually works, to show you guys like how it works. But, um, I will not be trading no real money. If you guys want me to do a video where I actually go through a full day of trading, try and flip a $100 account to $1,000, whatever it is, y'all let me know in the comments down below. Like the video up, I need a million likes if y'all want me to do that. But on to the strategy. So you see I have two indicators here. I have Bollinger Bands and I have the stochastic oscillator down in the bottom over here. Now all you're going to do if you're on PocketOptions, you're just going to come right over here to this little— where is the indicator button? Oh, this one right here. This— if you're on Pocket Options. If you're on any other, um, type of website, you'll just find we have indicators, and you're just going to choose the Bollinger Bands and the stochastic oscillator. Um, I hope I'm pronouncing that right. I don't know, sometimes my brain just don't be working when it comes to spelling. I'm not dyslexic, but I don't— anyways, so my settings that I have for the stochastic oscillator is 14, 3, and 3. So you obviously want to set your, um, your, your indicators to the same exact settings that I have for the strategy to work. For the Bollinger Bands, I have 20 and 2. The period is 20, deviation is 2, and I am on a 2-minute time frame. Now I'm just gonna go through this, um, chart, and I want you guys to see if you guys can kind of guess what the heck happens, why I get in these trades, right? I'm just go through it. Just tell me if you see any patterns. You're probably not gonna see it, but if you do, let me know in the comments down below. I'm gonna scroll through, tell me if you see anything that's just— it's always a pattern, the same thing happens every single time something happens. Y'all see it? No, you don't? Well, I'm gonna break it down for you. So, um, actually it's a perfect example right over here. So this Bollinger Bands, this is the Bollinger Bands right here. Whenever price breaks out of the Bollinger Bands and closes outside the Bollinger Bands, it always ends up going back up in, just because when it goes outside the Bollinger Bands, it's in an oversold market., and an oversold market has to go back up. It's the same vice versa with the overbought. So when it closes up above the Bollinger Bands, it has to go back down. So that's one clue— hey, words— one confluence, you feel me? We need multiple confluencies to want to get inside the trade and trust a trade. So the second confluence is down here, the stochastic oscillator, right? Let's see the same trade right here. This candlestick, it came out of the Bollinger Bands and closed outside of Bollinger Bands. And then on here, it's also outside of this yellow line, which— this yellow line is the, the same thing. It's an oversold market. So that means it has to go back up into it. Price likes being in this area, in this box over here. It doesn't like being outside of it. You see, every time it goes up, it ends up coming back down. Every time it comes out of it— every time it comes out of it, like over here, it comes back down. Every time it goes below it, it comes back up. Every time it goes below, it comes back up. So that's the second confluence we, we need. So it has to come out of here, it has to close outside of the Bollinger Bands, it also has to be outside of the stochastic oscillator. The third and final confluence that we need, you need to be able to identify candlestick, um, tails, right? So what I mean by candlestick tails, if you did not watch my video on technical analysis, you need to go watch it right now. I broke down a couple of the different candlestick formations that show you that the price is about to reverse, because you need to wait for the reversal candle that shows you and tells you that the price is about to go in the other direction. So what I mean by that, I'll give you guys a couple examples. So you see it came out of here, this candlestick right here, we got a green candlestick that's coming back up into the upside. The reason— why is it moving? The reason this candlestick is showing me it's going back into the upside is that if you look at the wick down here— can I take How do I take— I'm trying to take the thingy off. Okay, boom. So you see the wick tried to come down here, it tried to go back down, but it rejected it and end up closing all the way up here. This is a sign that the price rejected this area down here, therefore it's most likely gonna go back up. Now let me give you guys a different example, another example. So the same thing right here, this candlestick closed up here. Let me take off the lines here. I can see it. This candlestick closed out of the Bollinger Bands. It closed as well out of the stochastic. And then the next candlestick— you always wait for the next candlestick. As soon as it jumps out of the, out of the Bollinger Bands, you do not get in, even if you see the stochastic oscillator outside of the zone as well. You wait for the candle confirmation, because if you don't, you'll end up messing up, and I'll show you guys why. But here it closed outside of it. Hey, you The thing keep moving by itself. Is this— yeah, this is it. So, um, here it closed outside of the Bollinger Bands, and then we got this candlestick, this doji right here, which is a reversal candle. It showed me I was going to go right back down. So therefore, I would have bought in right after this candlestick closed. Well, I would have went in for a sell, the right one, right after the candlestick closed, and I would end up winning this trade, um, perfectly. But like I was saying, if you do not wait for the next candlestick confirmation, you'll end up getting messed up. Now I'll show you guys an example. So if we come over here in this corner right here, you see how this one closed outside the Bollinger Bands? That might— to you, that might look like a good trade. It's about to go back down because it closed outside of Bollinger Bands. It looks like it came out of here as well as stochastic. But if you go over, it kept going on the upside. The reason it kept going on the upside is simply due to the fact that you did not wait for the candle confirmation. Let me show you another good example as well. Okay, so right here, this candlestick closed outside of— this thing will keep just messing up. It's just, it keeps bringing me to the front of it because a new candlestick is being formed. It's making me lose where I was at. Let's see, let's see, where was I? But you guys understand what I'm saying. You have to wait for the candlestick confirmation. Like, these all closed outside of the box, and they're all outside of the stochastic oscillator, but none of these candlesticks showed me it was going to go down until we got this beautiful doji right here. And then you see the market ended up going down. So each of these candlesticks represents 2 minutes. I'm on a 2-minute chart right now, and then I always go in for a purchase of a 4-minute time. So that would be 2 more candlesticks. Every, every single one of these is 2— every single candlestick here is 2 minutes each. So what that means is if I saw this candlestick come out of here and I bought this candlestick, I said I was going to buy, that means this is the first candlestick, that's 2 minutes, and this is 4 minutes. So my price would have closed right here, therefore winning me the trade. Let's see another example. Let's see, I should have had these all picked out before I started. Video, huh? But if you guys want me to do— I'll do a live trading video. I'll kind of go in, show you guys just like me actually trading, show you guys the strategy actually works. I actually use the strategy. Okay, right here, perfectly again. Then we get the red doji out here, as well as the crossover over here on the stochastic oscillator. This is another confluence that I did not talk about. The green, the green line down here means the price is going up. The red line means it's going down. So if the red line is on top, the the price going down. The green line is on top, the price is going up. When it crosses over, that means it's a change of direction. So if it's the green line's been on top the whole entire time and then it crosses right here, the red crosses over the green, that means the price is about to go back down. And it's the same, it's lined up right here as well with our candlestick confirmation. The green is outside of it. We was waiting for a confirmation to make sure that the price is going to reverse. We get this confirmation, this candlestick, this red doji. We're going for a sell. 2 candlesticks down, we won. Just like I was saying, we got the— literally at the same spot, this red candlestick is the same point where the stochastic oscillator, these 2 moving averages, crossed over. Well, they're not moving averages, but they crossed over. So that's telling me the price is going to reverse. Now, like I said, the— every strategy does not work 100% of the time, obviously, but this strategy has been very profitable for me. As you can see, here's another perfect example. It came out of it, we got the candlestick confirmation, it went up. Another strategy— I mean, another example. This candlestick came out, we got the crossover down here, we got the red engulfing candle. These candlesticks, two candlesticks down, we won it. This one again, it came out, we got the candlestick confirmation, came down, we won it. This same thing, red candlestick, green came out, went up, we won it. Like I'm saying, this, this strategy has worked pretty well for me. I'm gonna try and get in a trade now if I can find one just for the video. But like I said, I'm gonna just trade on my demo account because I'm not trying to actually waste money. Because like I said, with the over— I don't trade on weekends. I would not suggest anybody trade any market while the market when it's closed, just due to the fact that the only markets that are open are these OTC markets, and the OTC markets can be manipulated by the brokers to make you lose money. We do not like losing money. That's why the brokers will, um, manipulate the market for themselves, because they also do not like losing money. But let me find an example real quick for me to get in a trade, and then I will, um, get back to you guys. All right, so real quick, I have not found a trade yet, but I did want to show you guys this one thing really quick So if you look down here, the lines, they're kind of just— it's— they're all intertwined. They keep swiggling and swiggling and swiggling together. Swiggling is not a word, is it? I know I just made that up. But they've been chilling under the stochastic oscillator, the zone for oversold market. I do not enter those trades when the chart— when the price has been under here for a long amount of candles or a lot, a lot of time. I do not enter those trades just due to the fact that you can't really predict when it's going to go back up because this is a fake out right here. This green candlestick, you might have thought that this was a nice reversal candle, but as you see, it keeps going back down. I, I don't enter any of these trades. I wouldn't suggest you enter any of the trades if the line down here, if you see it, is literally just chilling at the bottom of it. It's been at the bottom of it for a long time. We like long pushes— that sounded weird— but we like long— what am I saying? We like strong pushes to the upside for a quick reversal. If I can find a nice example, like this up here, we have this, this candlestick confirmation, then it drops down. Right here, it was not chilling above the line. It might be at the top of the line for a while, but it was not chilling at the top of the line the whole time. So I would have personally taken this trade and I would end up winning it. Now let me go back to trying to find a trade so I can show you guys this strategy actually works and I am not capping. Alright, so here's a nice example. We have Um, right now we're going for buy real quick. Um, we have the nice strong candles to come out closing under it, and then we have a nice little doji right here, which if the market does not play me, Mr. OTC, Miss Broker, or whoever, Mr. Broker, whoever it is that's behind here that might want to finesse my money, um, if it does not play with me, this should be a nice little win. Um, just a little $40 bet. Like I said, we're just on the demo account, so if I lose, I lose. I just want to give you guys a real example of it. Um, it would be nice to win this, so we're just gonna wait and see what this does. Hopefully win it. And, um, yeah. All right, so here we are with 10 seconds on the clock. It should be a nice win if the broker does not mess me up. Uh, 5, 4— yeah, we got this one in the bag. Um, so we made a nice little profit. Well, on a demo account, but anyways, I guess the broker doesn't like screwing over demo accounts. But I just wanted you guys kind of show you guys just, uh, just one example real quick. Oh, we didn't even win it yet. We got 14 seconds left. Oh, it's going up even more. I should put more money in. Oh, my thing was over here, my fault. But either way, we still did win. My camera just cut out, but either way, we still did win this trade. I just wanted to show you guys just one example of it so you guys can see it in action. Like I said, if you guys want me to do a video where I just do a bunch of different trades and just, um, kind of show you guys me actually trading on a day-to-day basis. Y'all let me know inside the comments down below. Like up the video for more binary options trading or HFX trading, whatever you want to call it. And, um, yeah, good luck on all your trades. I'm gonna see you on the next video.










