0:45
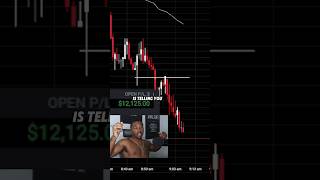
A candlestick shows four prices in one timeframe: the open and close form the thick body, while the wicks above and below mark the high and low. Watch a few candlesticks for a few minutes and you'll see how price actually moves.
A candlestick shows four prices in one timeframe: the open and close form the thick body, while the wicks above and below mark the high and low. Watch a few candlesticks for a few minutes and you'll see how price actually moves.
So candlesticks, they might look pretty confusing, but realistically all it is is telling you what price has done within a certain amount of time. So for instance, if you're looking on a 5-minute timeframe and you see these candlesticks, they're gonna have a wick at the top, which is just a straight line. It's gonna have a wick on the bottom, which is a straight line, and it's gonna have more so like a thicker kind of body. Pause. But all that's showing you is what number or what price that stock or crypto or whatever you're looking at, what it, opened at, at that 5-minute mark. It's also going to show you at— after 5 minutes is up, where that price is actually sitting at. And then the wicks is going to show you where price has been all throughout that 5-minute frame. Honestly, if you spend about 5 minutes, 10 minutes just looking at a candlestick, you'll start to completely understand exactly what it means.










