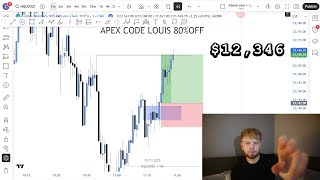
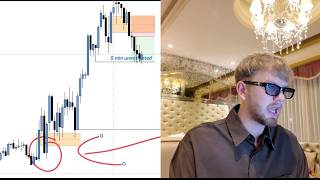
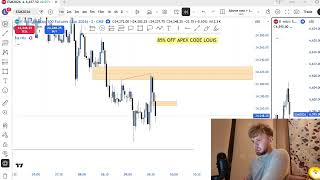
In this video Kai Davis (Speaker A) provides a detailed trade recap of a profitable ES futures trade that generated $12,246 using his proprietary "Inversion 5i Gap Model." He walks through a top‑down analysis, starting with the daily chart to establish a bullish bias at all‑time highs, then drills down to the 4‑hour frame where the bias remains unchanged due to a lack of bearish signals. The core of the strategy relies on identifying fair‑value gaps (FVG) and liquidity zones—both sell‑side and buy‑side—as the primary setup criteria. Davis emphasizes a time‑of‑day edge: if no long entry is taken between 9:30 am and 11 am, a high‑probability long can be captured between 11 am and 12 pm. He demonstrates a 1‑minute bullish fair‑value gap that aligns with higher‑timeframe bullish gaps, enters on the candle close, and immediately moves the stop loss to break‑even, achieving a 1:2 risk‑to‑reward ratio. The trade is presented as a clean example of the model’s claimed >80 % win rate on high‑quality setups. Throughout the video Davis promotes his free Discord community (38 k members) and a paid trading course, positioning himself as a leading educator in the niche.
Chapters
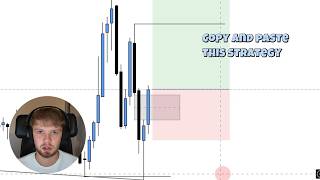
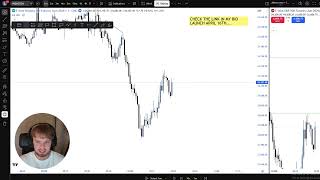
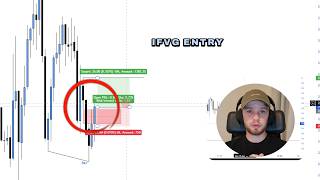
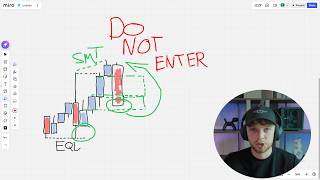
This is going to be a trade recap on a trade, a winning trade that you could have caught today. There were zero losers to take and only winning trades to take today in the market. This model has over an 80% win rate if you are taking the higher quality setups. It is my Inversion 5i Gap Model. So jumping straight into it, my top-down analysis, everything that you need to know about this trade. Now starting off, you guys loved the last video and you guys are loving this YouTube channel so far. Only posting the educational content, no fancy editing, just straight knowledge that I'm giving you guys on how you can really become profitable. Okay, so let's start off my top-down analysis. Whenever I first go into the charts, I look at the higher time frames. I start with the daily time frame. Now I'm just going to give you guys some information. This video is going to have a bit more of advanced knowledge in it, so if you watch the end and you do get a bit confused during it, just leave some comments below and I'm sure other people will help you out, or I will get to your comment. Or join my free Discord community. I have over 38,000 members, and you can ask in the general chat. And of course, join the trading course if you want to really level up your game. Starting with the daily time frame, we look to the left, we're at all-time highs. Whenever we're at all-time highs, I'm going to give you some simple advice. If we're at all-time highs, then be bullish. You can only be bearish if you have a strong reason to be bearish. And as you can see, what on earth would be your reason to be bearish in this market? I'm looking for fair value gaps and I'm looking for liquidity. That is the two main things I'm looking for on the higher time frame. If we're looking at this chart right now, I can't really see fair value gaps because we're chopping, and I can't really see that much liquidity. Of course I can see sell side liquidity, but I can't really see buy side liquidity other than all-time highs. Another thing to note that doesn't really affect today, but a lot of the time you have to remember that time is fractal. So if we're chopping on the higher time frames, a lot of the time we can chop on the lower time frames. And I do think that's why we're seeing a bit of slower price action in the last few days, because this daily time frame we're chopping, whereas before, back here when we're getting these big moves up, we of course wasn't chopping. Okay, so something to take a note— time is fractal. Because we're so bullish on the daily time frame, I'll then drop to the 4-hour. As you can see, this 4-hour time frame What time do we need to look at? Yeah, so we're trading back here, okay? I'm in the replay mode, so this, this price action right here is irrelevant. We need to look from right around this point. So this is the point that I looked when I opened up the charts. Now, same thing as I said on the daily time frame, I'm only going to be bearish if I can find a reason to be bearish. I can't find a reason to be bearish, then I'm going to be very, very bullish. And as you can see right here, there's not really any reason to be bearish. We're respecting this bullish value up to the left. And yeah, other than that, there's not a whole lot to go from. We've had a bit of trendline liquidity before this candle, and I mean, yeah, other than that, there's literally no reason to be bearish in my opinion. I mean, if we come down and if we inverse this bullish fair value gap, then I might be a bit more bearish because obviously that's what we trade— fair value gaps that are being disrespected. Okay, um, so yeah, that's my daily analysis and my 4-hour analysis. Very quite simple. There's not a whole lot going on. So because my daily bias is a bit more bullish, I'm obviously going to most likely look for long positions. Now, a bit of advice and a bit of advanced knowledge: whenever you are trading from 9:30 to 11 AM— now this is like serious, serious knowledge I'm dropping— whenever you're trading from 9:30 till 11 AM, if you can— I was looking at the wrong day. Whenever you're trading from 9:30 to 11 AM, if you don't get a single trade entry and your bias is bullish, then you still have to be, um, then from 11 to 12 you can catch an amazing long position. So from 9:30 to 11 AM, if there's no trade to be taken, for example today we didn't actually manage to catch any trade from 9:30, which I'll show you now, but then from 11 to 12 we got a very, very nice long position. The win rate is extremely, extremely high. We did also get a potential short position in the PM session, um, but that's not what we are focusing on right now. So yeah, let's look at the 9:30. So from 9:30 AM New York time, we kind of dropped down, we're getting some consolidation. If you're on my live stream, you would hear me say this whole stream I was waiting for some bearish fair value gaps and then a bearish fair value gap to be embossed. The only potential trade that we did have for long positions was this trade right here which was a 2-minute inversion fair value gap. So as you can see, we swept sell side liquidity perfectly. We instantly rejected from sell side liquidity. As you can see, this wick— when we wick away from a liquidity draw, that shows that there's rejection. And we mainly got displacement up. So as you can see, we have this very, very nice 2-minute bearish fair value gap. It wasn't a 1-minute, but if I play the price action out, we get such a strong displacement candle I didn't fancy entering into this trade. The only way I would have entered this trade was if we did not take this internal liquidity, then I would have entered long here, my stop loss to breakeven there, and that is exactly how I would have played that trade. But sadly didn't get it. But now again, like I said, if we don't get a long position from half 9 till 11:00 AM, if we drop down loads like we did today, and if your bias is bullish, and if we don't really take out buy side liquidity then 11 to 12, you can catch some crazy, crazy, crazy positions. So let's take a look at this again. Look at the time. Also in the stream, what I was saying was we create this bearish value gap. Yeah, we create this bearish value gap at 10:51. I said if we inverse this bearish value gap, I think we should at least come up to internal liquidity and then hopefully take us up to the highs. We did have some trendline liquidity here as well. Now the reason why this was such a clean trade in my opinion is because we are— one, we have a 1-minute fair value gap. If we check the higher time frames, this is not a 2-minute fair value gap. This is literally only a 1-minute fair value gap. As well as that, we are also respecting some bullish fair value gaps to the left. So we're expecting this bullish fair value gap here. We're expecting, uh, so yeah, we're expecting that 2-minute bullish fair value gap, which is very nice. And another reason we are bullish The only things that I do not like about this trade is we have some equal lows below, and these equal lows we actually ended up targeting later in the PM session. But nonetheless, this long position, we have an amazing, amazing stop loss to break even. So when— as price— as soon as price taps this point in the market, you can move your stop loss to break even here and be risk-free. A lot of the time, trades like this might stop you to break even, but the win rate is so high when you do catch a winning trade, the risk reward is normally amazing like it was today. So this is where I enter, on this bullish candle close above this bearish value gap. Another thing to note is we did actually take this high on ES, and I know that's why some of my Discord members did not enter into the trade. But remember, when you are trading, you cannot be a robot. You can't follow an ABC pattern and you can't stick to it every single day. Of course you need to have rules in place, but you just can't be a robot. No successful trader takes the exact same setup every single day, day after day. Of course they take the same model. I trade the exact same model. But for example, if, um, ES took this high on another day, I might not have wanted to enter it. But ES did take this high today, but I still entered into the trade because I'm not a robot and I know how the markets work. The reason why I like this trade was one, We trading from 11 to 12. My bias is bullish. We have some very, very clean trendline liquidity. We haven't really taken out buy side liquidity during the AM session. We have a very nice stop loss to break even. So this is where I entered into the trade. Again, the chance that this gets stopped to break even is quite high, but look, we do not wait for the retracement. As soon as this candle inverses, we enter. I do not wait for price action to come back down into this, um, inversion value gap, and then I enter— no, I am— I enter as soon as we get the candle close. My stop loss is already at breakeven now, and then I'm simply holding for this high. This has over a 1:2 risk to reward, and look at that displacement. And then we end up taking that high out, I believe. Yeah, perfectly. So yeah, an amazing 1:2 risk to reward, literally using fair value gaps and liquidity. I'm going to keep this video simple and quite short. Let me know if you did enjoy this video or let me know if you have any questions or if you think I missed anything in the analysis, um, because it is quite hard to do it when I don't have ES up. So maybe I missed an SMT, um, for example. But yeah, let me know in the comments if you want me to keep these videos coming. Keep up the good work. All the links are in my bio if you want to learn directly from me. My students' results are amazing. I'm one— well, I am the best educator in this space, um, And yeah, I hope you enjoyed. I'll see you on tomorrow's video.