$12,523 Winning Trade full top down analysis (80%+ ifvg stratergy)
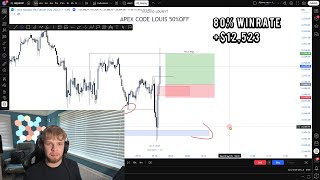
Kai Davis breaks down a $12,523 winning trade using top-down technical analysis across five timeframes, risking only 0.5% of his funded account. He identifies entry points using fair-value gaps and liquidity sweeps, places his stop-loss at break-even after internal liquidity is taken, and targets the news high for profit.
Chapters
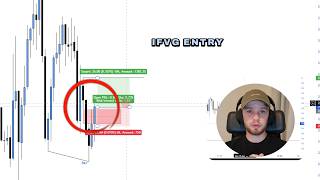
What is up everybody, we are officially back uploading on this channel. This is the second time I'm recording this video because I accidentally just deleted it, so I'm going to do it even better this time. I— this is a trade that I took yesterday, a very, very amazing winning trade. You would have made over $10,000 from only risking 0.5% on funded accounts with my 80% win rate inversion model, also including an LFBG, which I will get into further in the video. But yeah, I haven't uploaded a minute, a minute on this channel. We are back to daily uploads. Make sure you subscribe, we're nearly at 1,000. And today is also a special day because I've just launched my mentorship that I've been working on for a while. So if you do want to join that, the first link in my bio. If the link isn't there, that means it is fully filled. The pre-launch was today, the official launch is very, very soon, so make sure you get involved in that. And yeah, this was a trade we took yesterday. I I'm going to be doing a full top-down analysis on how you could have taken this trade and what you need to look out for in the future if you didn't take this trade today. Because in my opinion, this was an amazing trade to take, and it literally happened less than 8 minutes into the session. You could have been in and out of the markets, made loads of money, and then keep on trading. So starting off with a daily time frame, I don't use trends, I don't use trend lines, I don't care about trends. You shouldn't care about trends or trend lines either when you're looking at the markets and you're looking at the charts, what you need to notice for your daily bias, which simply means where you think price action is going to go, is look for fair value gaps and look for liquidity. Now this is a bit of an awkward situation because we are at all-time highs. So it's not actually awkward, it's actually very simple. When we're at all-time highs, your daily bias should be bullish, okay? You should not be bearish if we're at all-time highs. You only should be bearish if you have a strong reason for that. Being a bullish fair value gap on the daily has been embossed, which it has not. As well as that, what you can do is drop it on a 4-hour. The reason why this 4-hour fair value gap doesn't make me any more bearish, even though we've embossed these bullish fair value gaps, is because we've taken this sell side liquidity. So again, although we've embossed these 4-hour bullish fair value gaps, I wouldn't be bearish because we've taken this liquidity, we're at all-time highs, and the daily time frame is very, very bullish. Okay. So that's why I wouldn't be bearish whatsoever. So drop into the lower time frames, and what I'm really looking for— because this was just an amazing trade— and starting with this candle right here. Now this candle right here is really what made this trade so good. And you might be thinking, why on earth would this random candle at 8:30 be so important? This is called the news high and the news low, and statistically talking, you can check this for yourself, whenever we create a news high right here and a news low, they will get hit. Okay, this is two very, very strong draws on liquidity. The way that you're going to find a news high and a news low in the market is by going to forexfactory.com. And every single news event— you'll see a list of news events— every single news event that has a red folder next to it is an important event. And if you look at that time next to the news event then that is the time that the chart will show the Red Bull news. For example, today— well, yesterday on Forex Factory, we had Red Bull news at 8:30 AM New York time. So if we look at the charts at 8:30 AM, ideally you want to see a big candle. We've got a nice news candle. This high right here, the news high. This low right here, the news low. Two extremely strong draws on liquidity that statistically get hit most of the time. If we play the price action out As you can see, we come close to the news high, we don't actually end up taking it. We end up coming down, taking out the news low. There's something else that's very important to note. Just because we take out the news low does not mean that we have to come up and take out the news high. That's not how liquidity and that's not how the market works. Another thing is also these red lines are equal lows on the market. This is still pre-market, so I'm not actually looking at the chart at this time. I don't start looking at the chart until around 9:25 AM. So right here, I'd look at the chart, I'd look at the daily time frame, I'll note that my daily bias is bullish. I would note that we have equal lows right here that might want to get swept. We have sell-side liquidity resting here, and that's kind of all I would really know. Of course, I would also note that we have news highs above— the news highs above. My daily bias is bullish, so that means ideally I really want to be looking for long positions targeting these news highs. That would be best case scenario when we have news highs and the daily bias is bullish. If we play price action out, as you can see, this is open right here at 9:30. We come shooting straight down and we actually end up taking out lots of south side liquidity. We also take out those equal highs that we've seen. So as you can see, we sweep south side liquidity. Now you might be wondering what is so important and what is so nice that we came down like this. So yes, as you know, the daily bias is bullish. We want these new highs. The reason why this was so, so nice is if we look at the high time frames, what we have is this 1-hour fair value gap. So we're actually respecting this fair value gap. But not only is this nice on the 1-hour time frame because we're having some higher time frame narrative behind us— prices came down, tapped into this 1-hour, then rejected out of it— but what is even nicer is if we check the 15-minute time frame. So this is where the 1-hour time frame fair value gap was. The 15-minute we have this 15-minute bullish fair value gap right here. Why is this nicer than the 1-hour? This is nicer than the 1-hour fair value gap because one, this right here is an unmitigated fair value gap. An unmitigated fair value gap simply means that price has not tapped into that fair value gap before. So as you can see, this is obviously the candle that opened that tapped into the fair value gap. Before that, this was an unmitigated fair value gap because no candles came into the fair value gap. Why is this important? This is important because most of the time fair value gaps will be tapped into, okay? That is just a fact. Open up your charts, look at your charts, look at the markets. If you see a fair value gap, most of the time it will be tapped into. Why it will be tapped into? Because literally what a fair value gap is, is an imbalance in the market. It's where orders are resting in the market that have not been filled yet. So these orders want to get filled. That's why fair value gaps will come and be tapped into. This fair value gap is especially special because it is an LFVG. This is a more of an advanced concept and something that I've noticed in the market that works crazily. As you can see, we tapped into this last fair value gap of the leg from the swing low to the swing high. From— well, you could say that the swing high is all the way up there, but from the swing low— this is the swing low and as you can see, this is the closest or the last fair value gap from the swing high. So this is the— there's no other fair value gaps below this point. So we have this 15-minute fair value gap. Below this fair value gap, there's no other fair value gaps. Therefore, this is the LFG, the last fair value gap of the leg. Whenever we get a rejection out of this zone, this just means that long positions are so much more likely to work, and of course vice versa with short positions if we're respecting the fair value gap at the top. Now, we jump into the lower timeframe. So as I just said, we swept this sell side liquidity. We've tapped into this LFG, which is also a 15-minute unmitigated— well, it was a 15-minute unmitigated— it's also a 1-hour timeframe rejection. So look, not only are we tapping into this point in the market, not only have we tapped into it, we've rejected out of it very strongly with something called a displacement candle. A displacement candle is simply when we move fast in one direction. So boom, we get the string displacement candle. What do we then have? How are you going to enter into the market? We have this 1-minute bearish fair value gap. Now this fair value gap is extremely, extremely important. The reason why this is so important is because it is only on the 1-minute time frame. There's not a 4-minute, there's not a 3-minute, there's not a 2-minute, there's only a 1-minute. Another question that a lot of beginner traders ask is, why, why are we taking a trade from this 1-minute when we look at the 2-minute and there's bearish fair value gaps here? The reason why these fair value gaps are irrelevant is because on the 1-minute time frame we have something called internal liquidity. So when we emboss a fair value gap, price should either go to liquidity or an unmitigated fair value gap. Because we don't have an unmitigated fair value gap, we only have this internal liquidity, which is just all the liquidity that's not external. Being the swing highs, the swing lows, price should be drawn to this point in the market. Okay, I hope you're keeping note. Don't just watch these videos like it's Netflix, you won't learn anything. So of course, when we want to enter into the market, we want a bullish candle close above a bearish— bearish— you got inverse only on the 1-minute time frame displacement. Our stop loss is now only if we get a bearish candle close back below this bullet bearish fair value gap. Our take profit is the news high. Our stop loss to break even is if we take out this high right here, because this is internal liquidity. So as soon as we take out this high, then that's when all these fair value gaps to the left become valid. And once we tap into these fair value gaps, nobody knows if price action is going to respect these fair value gaps and come down, or break through them and go to the high. So that is why we'd be safe, stop loss to break even once we take this high. Stop loss if we get a candle close here, take profit at this news high because it is such a strong draw on liquidity. Respect on the LFBG liquidity sweep, just an overall amazing trade to take. And as you can see, look what happens, we enter into it, price instantly shoots up and takes the high. Now another question that I got asked is why did I take it even though ES didn't take the high, take in versus 5-hour gap, because it didn't. The reason being it is just such a nice trade, we have such an easy breakeven point. It's only on the 1-minute time frame. We're respecting that LFVG, the 15-minute unmitigated, we swept sell-side liquidity. It's just such an easy and simple trade to enter into, and my conviction was so high. And in my opinion, this is a trade that most people should be taking, especially if you've been looking at the charts for a while. Again, this is my first video back in a while. If you want me to stay consistent, make sure you subscribe and like. I will be giving away some funded accounts for somebody who's made it this far in the video. Just comment a nice message and with a smiley face at the end so I know you've watched all the way to the end, and I'll give away some funded accounts because I've been a bit inactive here. I will be doing daily uploads from now. Make sure you subscribe, notifications on. All the links are in the bio. I livestream every single day. If you're not seeing this video, it's because the folder has deleted again and I'll be very upset. So thanks you for watching this video, and I'll see you all tomorrow for a new daily upload.
More from Louis
I lost 4,000$ Today Trading and would do it again next week... (FULL TRADE BREAKDOWN)
Losing 4,354 and i would do it again tomorrow... (80% win rate model trade breakdown)