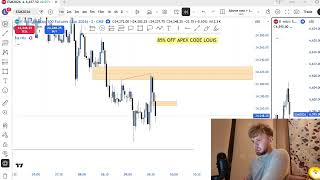
18,791$ Winning Thursday Trade Full Top Down Analysis (80%+ Winrate Strategy)
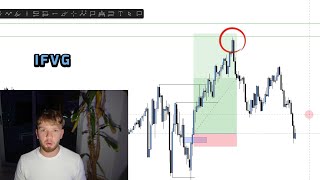
Louis walks through an $18,791 winning trade using top-down analysis on ES and NASDAQ. He identifies a bearish daily bias, finds entry at a liquidity level before a 9:45 news event, and executes with a 1:3 risk-to-reward ratio on a 1-minute candle.
Chapters
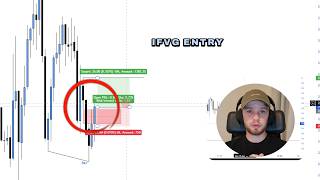
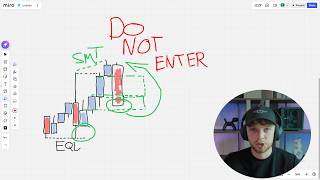
We are on a trading hot streak right now. It is crazy. And today, yet again, another amazing win to take in the markets. Absolutely incredible with literally just fair value gaps and liquidity. I posted a video on my Instagram story of me a few years ago when I was in college and when I worked my old job, and I'm sure that's a lot of, a lot of the same position that a lot of people watching this video is. Is in. And let me just tell you, your life can seriously change if you just put in the work and you put in the time, and you will see the rewards on the charts. No, you're not going to get rich quick trading. It might take you a few months. Who knows how long it is going to take? But if you put in the time consistently, you can look at a chart for less than an hour and a half a day, you can make over 6 figures a year comfortably, and and you never have to work a 9 to 5 again. You can go on holiday when you want. Anybody can do it. I was in the same position that you are exactly in right now a few years ago. Whether you're at the break-even stage, whether you're just completely unprofitable, whether you're very close to being profitable, I was in your exact situation. And I took these steps, I learned this strategy correctly, and now my life has changed. And you need to do the exact same. The reason why I'm saying this is because the price action is is finally starting to pick up again, and today we took a very nice long position. So starting off with the higher time frames right here, what's our daily bias? Our daily bias is bearish. Why is our daily bias bearish? We have inversed the bullish— it's the same as yesterday. If you watch yesterday's videos, we've inversed bullish fair value gaps. We've inversed this bullish fair value gap here. We've inversed this bullish fair value gap here. I'm not just making these videos up and they're random. Look at all the videos that I'm posting, all of the trade recaps. The same thing is happening on a consistent basis. I said yesterday, when we could see this candle only, I said my bias is still bearish even though we're expecting this bullish 5-hour gap because we have inverses 5-hour gaps. Therefore, price has a higher chance of coming down. And look what happened, we've ended up coming down again. But that's irrelevant. Predicting the market is irrelevant. You don't need to predict the market. Just react to what the market is telling you that it wants to do. And today we got this bearish candle close below this bullish fair value gap. Boom, our bias is bearish. Simple. Don't overcomplicate it. Our bias is bearish, uh, on the higher time frames. So let's look at the 4-hour time frame. So this is what the 4-hour time frame looks like. The daily time frame is bearish, meaning that ideally on the higher time frames we would be more inclined to take in short positions. Does that mean I will not take a long position? No. The winning trade I took today was a long position. It was a nice long winning trade. Why was I not completely opposed to taking longs? The reason being, if you look here, we've inversed this 4-hour bearish fair value gap. Now again, we had the same situation yesterday where we inversed the 4-hour bearish fair value gap, but why was I a bit different today and a bit more open to taking long positions than yesterday? The reason being, look at how we perfectly swept this low right here. We perfectly swept this low, rejected, came back up, and burst this fair value gap. So I know, although we didn't, and we have seen this in hindsight right now, but we could have so easily wanted to come up for this very nice strong liquidity right here, and then, you know, who knows what would have happened yet. But of course this didn't happen, but we still did manage to catch a nice long position on the lower time frame. So now let's drop into low time frames and keep all of that in mind. And I will actually be using the ES chart in today's trade recap because that is very important. So So at open, yeah, we come down, we have news at 9:45. So because we have news at 9:45, I'm not interested in trading before the red folder news. And as you can see, boom, right here, red folder news. Quick tip if you didn't already know: mark the high out, mark the low out. Two extremely strong draws on liquidity. As you can see, the news low has been swept, the news high is still intact. Um, we had this big bearish value gap because we have the news highs above the The only way that I would enter into long positions here was if we did not take the news high, and then this would be my stop loss to break even. 8 times out of 10, this would be a break-even trade anyway. But as you can see, um, we ended up sweeping the news candle on the inverse. Therefore, there would be no entry right here. Um, so let's just play the price action out. And again, so that was the news at 9:45. So right here, as you can see, we have this bullish 5-hour gap. You might be wondering Louis, your bias was a bit more bearish. These shorts look decent. Why did I not take the long position? Why did I not take shorts here? So context is key when you're trading. You can't just look and wait for a fair value gap to be in bus and then take a trade. You need to also have context. And right here we were looking at the ES chart, and imagine that you— this is the price action that you can see, okay? Don't look at this price action to the left. I know it's very hard to ignore, but but we just couldn't see this price action. So let me just do this. So yeah, so we couldn't see this price action right now. So, so if you see, we have this trendline liquidity. So trendline liquidity is simply— I'm just going to remove that. Just imagine we can't see these candles because we couldn't at the time. So we have this trendline liquidity, okay? Trendline liquidity is a very nice draw on liquidity depending on how strong it is. And all the trendline liquidity means is when you can draw a perfect trendline, for example 1, 2, 3 times. So we've tapped this trend line 3 times. We've came very close multiple times. What this means is there is so many stop losses resting above this market, and in simple terms, this is where price action has a very high chance of targeting. Not only did we have this trend line liquidity, we also had about 100 sets of equal highs. So we had like, we had equal highs here, we had equal highs here, we had so many equal highs above. Yes, the reason why I'm saying this was because if I was going to take a short position on NASDAQ, the only way that I would have shorted was if we got a candle close below on NASDAQ like we did right here. But also I needed a candle close on ES. And as you can see, we had the fair value gap on ES, it ended up being respected and not inversed. And if we play a price action out, it would be a price action out, this trade ends up working. So that's completely fine. You would like, you'd like to see fair value gaps go to the liquidity point even if you take it or not. So yeah, I'm more than happy that I didn't take this winning trade for that exact reason. Um, we had all this trendline liquidity above, and again, a big reason why I didn't take the short. So you might be wondering, okay, what does this mean? We've swept this low here, how could we now potentially catch long positions? So as you can see, we have this very, very nice bearish value gap. We have equal highs right here. These equal highs aren't the strongest draw on liquidity in the world, um, because they're right next to each other, but they are equal highs. And we started to create some trendline liquidity, which I'll show you in a second. Um, and what was also amazingly clean about this trade was, one, I wanted this liquidity above being the trendline liquidity. What did we create? We created a bullish SMT. So as you can see, we swept this low here on NASDAQ. We have the same low on ES. We did not sweep this low. Um, so what does this mean? This means if we get a long position, they are more likely going to work. Okay, as simple as that. Not only did we get that SMT, we look at this displacement candle. When we have a strong candle going in one direction, that is the perfect candle that you want to see, especially if it's going towards a trade that you want to take. On the next candle, we get another nice candle. Is this the nicest candle in the world? No, this is not the cleanest, nicest candle in the world. Ideally, we would have got a close up here, but again, we still did invest the 1 minute. This was a 1 and a 4 minute. The reason why I didn't wait for the 4 minute was, again, just my conviction to the, the draw on liquidity above, especially on ES. We had so many equal highs, we created the bullish SMT, we got the displacement up here, we had, um, that we rejected from sell side liquidity, so we also swept all this liquidity levels as well. So this is where I entered into my long position. Stop loss, of course, if we get a candle close below stop loss to break even at these equal highs. You can also take profits at these equal highs. I did not take profits personally here. I took my first profits right here, and then I held for my second take profits for these highs in the market. And look at this risk reward— a 1:3 risk to reward, and we get the most perfect reaction out of the fair value gap. Again, this is exactly what you want to see— very strong displacement, fast movement. Of course, it doesn't matter because we're in the trade as well, but just when you see this you know that you've entered a very good trade. Because most of the time when you enter into a good inversion 5-hour gap trade, you're not going to get a retracement back into the inversion 5-hour gap, okay? Price is going to shoot up to your take profit. And that is exactly what happened on today's trade. And again, I'll, I'll try and put a clip right here of the amount of people that took this trade in my Discord. Absolutely amazing. Just well done if you're being patient and catching amazing winning trades like this. Yes, you could have entered into these shorts and took a nice little short winning trade if your bias was bearish, which again, my bias was bearish. But because we didn't unbalance ES, I didn't take the shorts here, and I just had more conviction in the highs being with all the liquidity levels that we had. Um, does this change my bias? It mean that I'm now bullish for the rest of the day? Absolutely not. And my prior time frame analysis is still a bit bearish, and I will be open to taking shorts if I trade the PM session, for example. But I'm very happy with this trade and we get rewarded for being patient, waiting for the setup that we want. And yeah, this is the trade recap for today. Let me know in the comments if you do have any questions whatsoever. If you did watch this video and you like these updates, then please do leave a comment because of course they do take quite a bit of time to make and then upload to YouTube. So leave a comment below, like and subscribe to this channel if you're getting all of the value. In the link in my description, you can watch me trade live and also my mentorship. I actually have a mentorship called call it in about 5 minutes. This is for the serious traders who want to be one-on-one taught by me, have the private chat with me, have the private community where you're with a bunch of serious traders. We all trade some of the PM sessions together, and also it's just nice to be in that group where you get that one-on-one aspect. Because of course, in, in when I'm live trading in front of 240+ people, it's hard. Everybody has their own problems and it's hard to gets everybody one-on-one. Of course the live streams are amazing, but the mentorship just gets you to that next level. And I can guarantee that you will become a funded trader at least, and on the way to becoming profitable in the mentorship if you do what I say. So, so yeah, all the links in my bio. Thank you for watching this video. I will see you all in the next one.
More from Louis
I lost 4,000$ Today Trading and would do it again next week... (FULL TRADE BREAKDOWN)
Losing 4,354 and i would do it again tomorrow... (80% win rate model trade breakdown)