9,837$ Winning Trade with just IFVG's & Liquidity (full top down trade analysis break down)
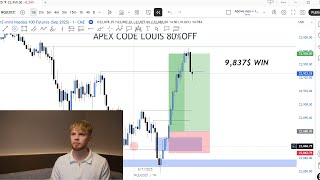
In this instructional YouTube video, Kai Davis walks through a live trade that generated roughly $8‑10k on a $50k account by applying his fair‑value‑gap (IFVG/LFVG) and liquidity‑based strategy. He begins with a top‑down bias assessment using daily and 4‑hour charts, noting a bullish bias at all‑time highs. He then drills down through 1‑hour, 15‑minute, 1‑minute and 2‑minute timeframes, explaining how he identifies a bearish fair‑value gap that is “embarrassed” (filled) and then uses the resulting bullish reaction as a long entry signal. Throughout, he emphasizes the importance of context—daily bias, internal liquidity points, and higher‑timeframe LFVGs—to justify the trade. He details entry execution, position sizing (0.5% risk on a $50k account), stop‑loss placement, breakeven adjustments, and profit‑target levels (1:2 risk‑reward, with potential trailing). The video also includes promotional calls to join his Discord, purchase a mentorship/course, and a giveaway for viewers. The overarching claim is that the strategy yields an >80% win rate when applied correctly, and the video serves as both a trade recap and a marketing piece for his educational offerings.
Chapters
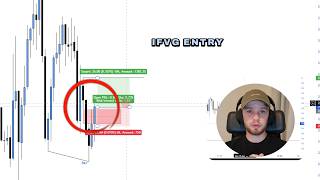
It is not a matter of if you're going to be extremely profitable with this strategy, it is just when. When are you going to start using fair value gaps and liquidity properly to catch simple and easy trades like this? I'm going to be showing you the full top-down analysis. This was a trade that we caught on Tuesday, an extremely simple trade to enter into with an amazing risk to reward and clear entry criteria to get into it. Now all I use is simply fair value gaps and liquidity, and if we enter this trade with a simple 0.5% risk on a $50K account, over all of our accounts, this trade would have made you around $8,000 to $10,000, which is absolutely amazing. And again, this win rate is over 80%, so 80% of the time if I see this trade, I know that 80% will be a winner and 20% will be a loser. And that is incredible. Now let's jump straight into an— and to the analysis. We're starting with the daily time frame. Now just off the bat, this this is going to be a bit more advanced. So if you are a newer trader and you're getting a bit confused, just leave some comments in the questions below— leave some comments in the comments below— or join my free Discord, which has over 38,000 members, and I'm sure I will get back to you there. And of course, if you want to learn the strategy properly, get the trading course or the mentorship. Okay, starting with the daily time frame, if we're looking at the higher time frame, this is what you go to. We use our daily and we use our 4-hour time frames to find our daily bias. All the daily bias simply means is where we think the price action is going to go on the higher time frames. And if we are looking at this chart starting with the daily time frame, as you can see, we're at all-time highs. So we have not really anything to go off to the left. And when this happens, most of the time we're just going to be bullish, okay? So most of the time we're just going to be looking for long positions mainly because our bias is bullish because we're at all-time highs. And when we're at all-time highs, nobody knows when we are going to come down. We could come down literally from here. We could want to come up and then come down. We could want to keep coming up and then come down. What I'm trying to say is absolutely nobody knows when we want to come down, okay? So do not try and predict it. When you are looking for your daily buys at all-time highs, the best way you're going to find it is only be bearish if you have a reason to be bearish. If you have no reason to be bearish, then be bullish. If we look at the daily, there's no reason to be bearish, so we're bullish. If we look at the 4-hour, we're respecting this bullish fair value gap. We've embossed a small 4-hour bearish fair value gap there. Our bias is also very bullish on the 4-hour. And then same for the 1-hour. If we look at the 1-hour time frame here, we're still respecting this bullish fair value gap. We're respecting this bullish fair value gap. And again, there's literally no reason to be bearish here, so we are more bullish. So now we drop to the lower time frames. Let's go into the replay mode and find out what we were actually looking for and why we would enter into a trade like this. Now starting off, if you don't know anything about my strategy, I simply wait for fair value gaps to be embarrassed. So right here we have this bullet bearish fair value gap and we've got a bullish candle close above it. So that's when I will look for the entry. Now of course we need context. What most traders would do in a situation like this is they would see this type of trade as a break of structure or a change of character to the downside, whatever you want to note this as. And they will then see that we have a bearish fair value gap. And what most traders are taught to do is take short positions like this from a bearish fair value gap. And this is just simply incorrect. You're not going to have anywhere near as high as a win rate that I do if you're shorting from bearish fair value gaps. You need to do the opposite, okay? And you need to wait for them to be disrespected and then enter into longs. But what you need, which is most important, is context. If you don't have context, then you're not going to be a good trader. All context is, is simply reasons to enter into a trade or reasons to not enter into a trade. Our first context that we have here is of course the daily time frame. On the daily time frame, we are bullish, which means we are more inclined and we want to take long positions buys. An average trader would look at the chart right here and think, oh, we're in a downtrend. We create a, a higher low, a lower low, a higher low, a lower low. We're now going to come up, create a higher low, and then what would the average trader think? We're going to end up carrying on coming down. But no, this is completely incorrect because our bias is bullish. We don't care about the trend. We simply would rather a long position. Another context, what do we have? We have a swept sell-side liquidity, we have a very nice internal liquidity point which is right here, which basically means if we entered into this long position, there's two main things that price action should do. Either one, come to an unmitigated fair value gap, or two, take some liquidity. And as you can see, we don't have an unmitigated fair value gap above on the 1-minute time frame. So where price action is most likely going to go is up to these points right here, which is the next liquidity point. Another reason why this trade was so good to enter— now this is getting quite advanced— if we go to the higher time frames, as you can see, price came down and perfectly respected this bullish fair value gap. Not only is this a bullish fair value gap, this is also an LFVG. So as you know, fair value gaps, fair value gaps are everywhere. They are simply just orders in the market that haven't been filled yet. The last fair value gap of the leg from the swing low to the swing high. This is called the LFVG, and when price action respects these points in the market and we get a reaction out of it— for example, right here, price action has came down, tapped into this LFVG, and then we've got this bullish reaction straight out of it— this is a very good sign. Of course, I'm never going to end up directly off an LFVG, but you're using it as context. I think it's the same on the 4-hour time frame. Again, never mind, never mind, we're not respecting any LFGs on the, on the 1 hour— sorry, on the 4-hour, just on the 1 hour. Now let's check the 15-minute time frame. On the 15-minute time frame, we actually are. So as you can see, we've perfectly tapped into this 15-minute bullish LFG right there. The reason why it's an LFG is because we don't have any other bullish fair value gaps below it. We only have this last fair value gap of the leg, so that is the LFG. Now, boom, we drop to the lower time frames. As you can see, we've perfectly tapped into this LFVG. Why would lungs be a lot nicer here than if we got a lung position here, for example? Or as you can see, we got— we could have got a lung position here, but these would not have been as nice, and I wouldn't really been as interested in lung positions here than I would here now because of this higher time frame reaction. Now, this is what a lot of people actually take for granted. You need to look for the higher timeframe analysis. It's the same as the higher timeframe being the daily timeframe. Our bias is bullish. We've now tapped into the higher timeframe unmitigated bullish fair value gap, which is the LFG, and now we're getting a potential long position. Okay, and now I know a question that some of you might be asking. With my strategy, you have to check the other timeframe. So we have the 1-minute here, then we need to check the 2-minute to make sure there's fair value gaps or no fair value gaps. We go to the 2-minute time frame. As you can see, we have this 2-minute unmitigated fair value gap. Now this is very, very important. You cannot trade like a robot, and no strategy is fully, fully mechanical. Now what I mean by that is, yes, we have rules for best case scenarios, and the best case scenario would be if we have a fair value gap on the 1 and the 2-minute time frame, then best case scenario we enter into long positions when the 1 and the 2-minute fair value gap both inverse. But like I just said, we are not robots and we don't have to only enter into the perfect setup. So the 1-minute has a fair value gap, the 2-minute has a fair value gap, the 3, 4, 5 does not have any of the fair value gaps. So it is only on the 1-minute and the 2-minute. On this next candle, as you can see, we get a nice displacement candle. And now all a displacement candle is is a very nice, clean, fast-moving candle in one direction with not really a lot of wick. So this isn't the greatest displacement candle, but it is still quite a nice strong candle. And also, again, this is not the best case scenario, because best case scenario, if we're entering into a long position here, we get a nice displacement candle from here and then we inverse it there, we get a much better risk to reward and we enter into long position. But again, We're not robots. We need to be able to adapt to the market. So right here, this is where I get my entry. Now you might be wondering, this is not a 1:1 risk reward to this internal high, and that is correct. This is not where we take our profits. So just because this isn't a 1:1 risk reward to the first liquidity point doesn't mean that you can't enter into the trade. Our first take profit will be this high right here, which is an extremely nice draw on liquidity, being a very obvious liquidity draw. Being the liquidity high. And also, it is a very nice risk to reward. As you can see right here, a 1 to 2 risk to reward. We also have equal highs above, which you could leave runners to, but I want to risk towards— so if you're risking $5,000, you're gonna make $10,000 on this trade here or there. Of course, I said $8,000 to $10,000 because your stop loss might be a bit lower around here depending on how you manage your risk. Another thing that you could do on a trade like this because we haven't embarrassed the 2-minute time frame. Again, this is a bit more advanced, and this is what I would personally do, is most likely use an aggressive stop loss to break even at one of these points in the market. Again, only if you're not convicted with the 2-minute candle being closed. I know some people would only enter if the 1 and the 2-minute does get closed. Yes, you can do that, but a lot of the time you will miss out on trades like this if you only wait for all the fair value gaps to be embarrassed. Okay, so just try and get used to how the markets work Because we're respecting this LFG, we've had a very nice bullish reaction out of the LFG and burst this 1-minute bearish fair value gap with displacement. This is where I entered into this trade. As you can see, the next candle is perfect. Another question that I guess gets asked a lot is why do we not wait for price to retrace into the inversion and then look to long? And the simple answer is, on the perfect and the best trades in the market, when you enter most of the time you're not going to see a retracement. You're just going to see price action shoot up to the high. I say most of the time, when price action is moving better and you get a very clean trade, this is exactly what price will do. And then boom, right here we've taken out these two potential breakeven points. So this is where you go stop loss to breakeven. Your take profit, of course, is at this high, and then you can leave runners to these equal highs above. And as you can see, that high gets perfectly taken out, and then this high doesn't get— doesn't quite get taken out, but I would have took most of my profits here. Or, or you could have also trailed your stop loss. So the way I actually played this was when we've taken this high with this candle, I move my stop loss to right here in the market. So I drag my stop loss all the way up to here, and then I'm in a risk-free trade. If price action comes down and taps me back out, which it does, I've still hit my original 1:2 risk to reward target. So it's a win-win. If price ends up carrying up and going up, I'll just keep trailing my stop loss, so I'll just make even more and more money. So it's a win-win situation. If you found this video useful and you want me to do more trade recaps on my YouTube channel, please subscribe. This content is extremely valuable because like I said, it's not a matter of does this strategy work, it is literally when are you going to put in the time and learn it correctly. The amount of money that I make and the amount of money that my students are making, it is literally stupid. You just need to learn how to trade the strategy right, and most importantly, have good risk management and have good discipline. Again, leave a comment below if you made it all the way to the end of this educational video. I'll be giving a funded account away. Just leave a comment below and leave a little smiley face so I know you've watched it all the way to the end. If you do enjoy this educational content, again, subscribe with notifications on. This YouTube channel is going to give so much value. And if you do want my one-on-one mentorship or want to join the trading course or or watch me trade live, all of the links are in my bio. The results are crazy. And yeah, I hope you enjoyed this video and found it useful. Let me know what videos you want me to make next. I'll see you all in the next video.
More from Louis
I lost 4,000$ Today Trading and would do it again next week... (FULL TRADE BREAKDOWN)
Losing 4,354 and i would do it again tomorrow... (80% win rate model trade breakdown)