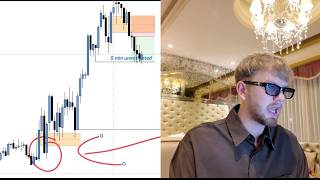
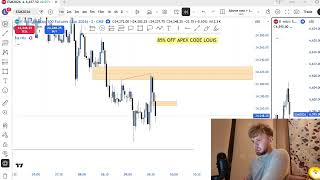
In this advanced tutorial, the presenter—who runs a large Discord trading community—explains how to determine a trader’s daily bias (bullish or bearish) by analyzing higher‑timeframe fair‑value gaps (FVGs) and how that bias differs from the concept of drawing liquidity. He defines fair‑value gaps as three‑candle patterns where the first and third candles do not overlap, describes how to detect inversions and respect of these gaps across daily, 4‑hour, 1‑hour, and 15‑minute charts, and introduces related concepts such as unmitigated gaps and the Last Fair‑Value Gap (LFVG). The core teaching is that a trader can maintain a bullish daily bias while still targeting bearish liquidity draws on lower timeframes when a lower‑timeframe FVG is inverted but higher‑timeframe bias remains unchanged. A live market example is walked through step‑by‑step, showing how a 1‑hour bullish FVG inversion creates a liquidity draw despite an overall bullish daily bias, and how the trader can take short positions or wait for the unmitigated gap to be filled before entering long positions. The video emphasizes multi‑timeframe confluence, the importance of not letting a lower‑timeframe inversion flip the higher‑timeframe bias, and offers guidance for scaling up to $100k+ monthly trading. Promotional calls to action for the Discord community, live streams, and subscription are included at the end.
Chapters
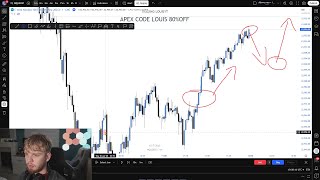
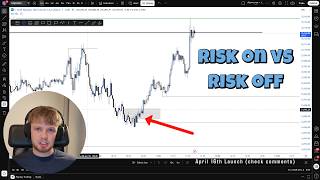
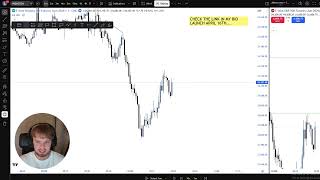
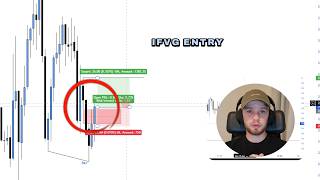
This is going to be an in-depth video on absolutely everything that you need to know about identifying your daily bias and finding the difference between your daily bias and liquidity. So this is going to be a bit more of an advanced video, mainly for those traders who want to scale up, be making $100,000 plus a month from trading by using more of the advanced techniques. Okay, so of course, if you don't know, I run one of the biggest trading communities, educational side of things. So I have a Discord of over 38,000 members. And of course, what a daily bias is, is where do you think price action is going to go on the higher time frame. So if I'm looking at the daily time frame, my daily bias would either be bullish or bearish. So do I think price action is going to go up on the daily time frame, or do I want— think that price action is going to go down? If I think it's going to go down, then my bias would be bearish. If I think price is going to go up, then my bias is going to be bullish. Okay, you kind of have a neutral bias sometimes, but ideally you want to have a bearish or bullish bias. The reason for this is because then if we drop on the lower time frames and then we look to enter into trades, then we can hold trades for longer and we can be more bullish or more bearish on trades that align with our higher time frame analysis. Okay, so what I want to focus on first of all is understanding how you're going to find your daily bias. Now I don't want to make this too long because I don't want this to be the main reason for this video. I want the main reason to be going into more advanced things and explaining to you guys what is the difference between liquidity and daily bias. So when should you target a liquidity versus your daily bias? Now what I mean by that is your daily bias can be bullish, but you might want to target a bearish sell-side liquidity. I'll give you an example of that later in the video. But to start with, the way that you're going to find your daily bias— and first of all, I must note, it is a lot trickier right now because as you can see, we are getting a bit of consolidation and we're just bullish. So Side note, whenever we're trading at all-time highs— so whenever we are trading at all-time highs and there's no price action to the left— your daily bias has to be bullish, okay? Your daily bias cannot be bearish if we're at all-time highs unless you have a very strong reason. So right now, because we're at all-time highs and we haven't inversed any fair value gaps, my daily bias is completely bullish. Now, the way that I find my daily bias is by checking for fair value gaps that have been inversed and that are respected. So if we're looking at the NASDAQ and we're looking at the daily time frame, what I will note is that we have some bullish fair value gaps and we have zero bearish fair value gaps. So we only have bullish fair value gaps, and as you can see, they are all being respected and we are just simply going up. Therefore, my daily bias is bullish. It is as simple as that. The only time that my daily bias would be bearish is if we get a bearish candle close below a bullish fair value gap, which you can clearly see we did not have. I will then drop to the 4-hour time frame. I'll also check for any fair value gaps that have been embossed. As you can see, we've embossed this bullish fair value gap here. If you don't know what a fair value gap is, it is just a 3-candle pattern formation when the first candle and the third candle don't touch, connect, or overlap. So as you can see right here, candle 1, candle 2, candle 3— the first candle and the third candle don't touch, connect, or overlap. So this right here is a bullish fair value gap. So yes, we've inverted this bullish fair value gap. Why am I not bearish? Because we're now respecting this bullish fair value gap right here, and we're at all-time highs. So it's very hard to be bearish at all-time highs. But now going into what I want to focus on this video— when should your bias change compared to when should you target liquidity? Now the reason I want to make this video is because there is a perfect example of what's happened on today's example. So this is today's price action. As you can see, this is a price action here, um, at open. So this is at open, 9:30 AM. This is the chart that we're looking at. As you can see, we've embossed this bearish fair value gap. We've embossed this bearish fair value gap, so we're bullish. Price action should go to the next liquidity draw, as it has. But my bias isn't bullish because of the 1-hour time frame. My bias is bullish because the 4-hour and the daily— the reason why I'm saying this is if we play the price action out As you can see, this next candle, we get a very, very, very strong bearish displacement candle. Now, is my bias going to be bullish because we inverse the 1-hour bullish fair value gap? No, because if we look at the higher time frames, being the 4-hour time frame, nothing is happening. We don't have any inversions of any bullish fair value gaps. Now again, this is something more advanced, so if you're a newer trader and you don't understand this don't worry, come back to this video at a later date. If you're a more advanced trader, then listen up here. So as you can see, we've embossed this 1-hour bullish fair value gap. We've embossed it here. If we go to the 4-hour time frame, we've not embossed any fair value gaps whatsoever. If we go to the daily, we've also not embossed fair value gaps, or we're not respecting any. So what do I notice when I go to the 4-hour time frame though? I notice we have a 4-hour fair value gap that is unmitigated. All unmitigated means is that we have not tapped into the fair value gap yet. So here we have a bullish fair value gap, it has not been tapped into, and all a fair value gap is, is where orders have been left and not filled. So this bullish fair value gap is here, and there is imbalances in the market here of orders which haven't been filled, leading to a high chance that fair value gaps get filled. Because of course, as you know, when we create a fair value gap on any time frame most of the time it is likely to get filled. So going on to my point, because we've embossed this 1-hour bearish fair value gap, we have a 4-hour unmitigated fair value gap. We also have a 1-hour fair value gap also being an LFVG. If you don't know what an LFVG is, then it is simply the last fair value gap of the leg. So from the swing high to the swing low, this is the last bullish fair value gap of the leg. Therefore, this is a bullish LFVG. Very, very strong confluence. Okay, so keeping this all in, in mind, what I just said— nothing happened on the 4-hour, nothing happened on the daily. The 1-hour, we've burst this bullish fair value gap. So although my daily bias is still bullish and I want price action to go up here, my draw on liquidity for when I'm trading is this 1-hour bullish fair value gap. So what I mean by that is, yes, I'm more than happy to enter into short positions even though my daily bias is bullish still, because we've invers— this bullish fair value gap and we have a strong draw on liquidity below that could easily want to get targeted, being the 4-hour and the 1-hour unmitigated fair value gap. Of course I'm not going to trade the higher time frames, and of course my bias is not going to switch just because we've invers— a 1-hour. Now this is an example of a 1-hour bullish fair value gap. You can also do this on the 15-minute. So let's say if we invest a 15-minute bullish fair value gap but we haven't done anything on the daily or the 4-hour, my 15-minute— not bias, but my 15-minute drawn liquidity might be a low in the market, but that doesn't mean that my daily bias wants to be in that same direction. Okay, let me know if this is all making sense in the comments, or let me know if you want me to do more simple videos for maybe less experienced traders. But if you are finding this useful, please leave a please leave a comment below. Okay, so now that we know that the daily bias is still bullish, but we want this to be hit, okay, so we want this to appear be hit. I'm more than open to taking short positions. What happens? Price comes down, taps into this fair value gap again. This whole time as well, by the way, I can still enter into long positions even though I want this draw liquidity. That is just best case scenario. If I come up here and I get a perfect bullish setup and this gets disrespected it's really not the end of the world. I don't mind, my bias doesn't change. But best case scenario, we inverse this fair value gap. We— in this example, we inverse the value gap on the 1-hour here. Now the draw on liquidity is most likely going to be this unmitigated fair value gap. It could even be the lows, but mainly this unmitigated fair value gap. Best case scenario, we tap into this unmitigated, then get a long position from there. And that is exactly what happened today. The 1-hour inverse, we came to that 1-hour draw on liquidity, the bias stayed bullish, we got a bullish reaction from that fair value gap, and then we look for long positions the whole time. Okay, pretty simple. This is just a video explaining the difference between a bias and a draw on liquidity. Again, a bit more advanced. I hope you found this video useful. If you want me to go even more in depth on stuff, I know in my live stream today— if you didn't know, I live stream every single day on Discord— in my live stream today, I went very, very in depth on some concepts that I, I use when I'm trading. If you want me to do more videos like this that is more in-depth and purely about trading, let me know in the comments. If you want to watch me trade live every single day, all the links are in my bio. I hope you enjoyed this video and subscribe because I'm going to be pumping out content here. Let's go!