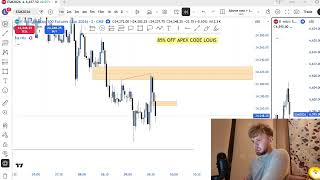
Best way to use liquidity when day trading (ADVANCED) 80%+ winrate
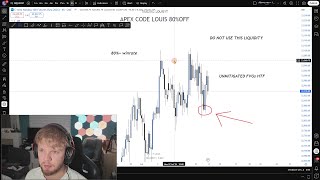
In this instructional video, the presenter explains the fundamental and advanced concepts of market liquidity and how to exploit them for high‑probability day‑trading entries. He defines liquidity as the concentration of other traders' stop‑loss orders and distinguishes sell‑side and buy‑side liquidity. The tutorial walks through the most common liquidity draws—swing highs/lows, equal highs/lows, and trendline liquidity—illustrating how each creates predictable price targets. The core advanced material focuses on Fair Value Gaps (FVG) and especially unmitigated Fair Value Gaps (UFVG) and LFVGs, describing how these gaps represent order‑book imbalances that price tends to fill. Using higher‑timeframe (1‑hour, 4‑hour) charts, he shows how to identify UFVGs, anticipate where price will be drawn, and align lower‑timeframe entry models with those liquidity targets. Throughout, he intersperses promotional calls to his mentorship, courses, and daily livestreams, and encourages viewer interaction via comments and a giveaway. The overall message is that mastering liquidity draws and UFVGs can dramatically improve win rates and profitability for both beginner and advanced traders.
Chapters
This is going to be a raw video on absolutely everything that you need to know about liquidity if you are a beginner or an advanced trader, because I am going to be going into how you use liquidity with unmitigated fair value gaps. So not only your obvious draws on liquidity, I have made a stupid amount of money from trading, and finding a draw on liquidity and understanding what liquidity is has to be one of, if not the most important thing about trading. I don't care what anybody says. One of my students has made over $100,000 in the past 6 months, and liquidity is a big part of that. One of my students made $3,000 yesterday, and liquidity is a big part of that. Okay, so let's jump straight into it. First of all, you need to understand what liquidity is. There is different types of liquidity, but all liquidity is, is simply where other people's stop losses are resting in the market. So let's say if we are looking at the chart, where does price like to be drawn to? Price likes to be drawn to liquidity because that's where stop orders are resting. For example, we have this low in the market right here. This is an interesting low, otherwise known as sell-side liquidity, because there are stop losses resting below this point of the market. So what is price action most likely going to be drawn to? Price action is most likely going to be drawn to this draw on liquidity. Okay, simple. Liquidity is just where price action wants to be drawn to because it's where people's stop losses are resting in the market. Okay, now a fair value gap. I'm going to tell you what a fair value gap is because it is also another draw on liquidity that a lot of people don't talk about. A fair value gap is simply an imbalance in the market, so where orders are resting that have not been filled yet. Most of the time Literally go in the charts, look at fair value gaps, and you will see most of the time fair value gaps will get filled. And that is simply because there are orders in these fair value gaps exactly like this. So what happens? Price ends up filling this fair value gap. So price wants to come fill the fair value gap, grab the orders, then one, either go and carry on in the direction it was going, or two, inverse that fair value gap and then go in the opposite direction. That I won't be covering my strategy, strategy today. If you want to learn my strategy, then all of the links are in my bio. Okay, let's start, start off with what sell-side liquidity and buy-side liquidity is. So first of all, we'll be covering the most common liquidity draw in the market, which is simply swing highs and swing lows. This is simple market structure. So let's say that these lines are candles. We come up, we create a higher high. At this higher high, we have buy-side liquidity resting in the market because it's where we will be targeting if we are entering to buy lungs into the market. So let's say that we enter into a long position here for whatever reason. The most probable chance that where price action is most likely going to be drawn to and where your take profit should most likely be is at the swing high, because that is where other people's stop losses are resting up here. Therefore, you target that point. So higher high, this is buy side liquidity because it is the swing high. Price action comes up, takes this buy side liquidity Once we take liquidity, that liquidity is swept. We no longer care about the liquidity. What have we just take— what have we just left? Sell-side liquidity. This is where you'll be targeting if you're entering the shorts. Where is price action most likely going to go if you enter into a short position? To sell-side liquidity. Of course, liquidity does not have to be taken every single time in the market. Another common mistake that traders make, which I'm going to let you know from the start Just because we take sell-side liquidity does not mean we have to then go for buy-side liquidity. Or just because we take buy-side liquidity, for example right here, does not mean that we now have to go for sell-side liquidity. That's not how it works, okay? So you must note that. Again, swing high, swing low here, swing high here. These are all just strong draws on liquidity. As I just said, trends, not trendline liquidity. Swing highs and swing lows are the strongest and most common draw on liquidity. They might not be the strongest draw on liquidity, but they definitely are the most common draw on liquidity. So all here again, swing low, sell side liquidity resting below here, swing low, sell side liquidity resting below here. Same again, those are sell side liquidity. If you enter into a perfect short position here, where are you going to target? Because where is price action most likely going to be drawn to? These sell side liquidity here, the sell side liquidity here, the sell side liquidity here. Why? That's because where your stop loss is most likely, where other people's stop losses is most likely going to be. Okay, moving straight on to my favorite draw on liquidity before I jump into fair value gap draws on liquidity in the live chart. So my favorite draw on liquidity is simply equal highs and equal lows. Let's say when price action comes to the exact same point in a market more than once, so let's say that this price action came to this exact same point in the market, imagine that these two are perfect This creates liquidity, and this creates a very strong draw on liquidity, and in my opinion, my favorite draw on liquidity. So what's resting up here? Lots of buy side liquidity, loads of people's stop losses. So let's say if I entered into a long position here for whatever reason, it doesn't matter what strategy I use, where am I most likely going to target? I'm most likely going to target Oh, my dog's going off. I'm most likely going to target the buy side liquidity that's resting in the market. Okay, simple. And of course, it is the opposite for equal lows. If we have equal lows in our market, where's price action most likely going to target? The equal lows. You get it. This is an advanced class. I'm not going to waste time on that type of stuff. Just, you can use some common sense. It's the same for equal lows. Okay, moving on to the last Draw on liquidity. I'm going to show you trendline liquidity. Same again, boom, trendline. If we can draw a perfect trendline, so let's say this is a perfect straight trendline, what is this called? This is sell-side liquidity. Again, what is it? You guys get it by now. This is where loads of people's stop losses is. If we get a short position, where's price action most likely going to target? This trendline liquidity. You can set your take profit there. And of course, it is the same for if we have buy-side liquidity. If we enter into a long position, where can we target? Buy side liquidity. Okay, trendline liquidity, another strong draw on liquidity. You might have had this as high resistance liquidity as buy side or low resistance liquidity run as sell side. Okay, the reason why I'm going through this so quickly is because you guys should understand it, and two, because I want to get into the more advanced stuff, being the draws on liquidity, which is an unmitigated fair value gap. Okay. So let's look at today's example right here. This is from today's chart. This is today's live example. As you can see— let me make sure. Okay, yeah, I'm right. Okay, so as you can see, this is the chart. So now we're looking at the chart, and now we're looking at examples. It doesn't necessarily matter what strategy you use, but of course I'm going to talk about my strategy because I think it's the best strategy in the world. I do one-on-one mentorship, and I have a trading course, and I livestream daily. If you want any of those things, the link should be in the bio. Okay, so my strategy, long story short, I wait for a fair value gap to be embossed, then I enter into a position. And right now I'm looking at the 1-hour time frame, so I'm not— I do not trade from the 1-hour. I get the draw on liquidity from the 1-hour. Because we have now embossed this 1-hour bearish fair value gap, where should price action most likely be drawn to? This high right here. Why? Because like I just said, This is swing high and swing low liquidity. We come up, create this high, buy side liquidity. We come down, create this low, sell side liquidity. We come back up, create this high, buy side liquidity, and then sell side liquidity. Do you get what I mean? But because my strategy— I've just had a signal for a long position, let's say here I entered into the long position. Of course I'm not going to enter into this trade, but this is on the higher time frame telling me where price should go. So price should be drawn to this liquidity. But if I check the 4-hour time frame, why is this a very, very strong draw on liquidity? One, it's not only a nice little internal liquidity swing high, it is also an unmitigated higher time frame value gap. Okay, this is very important to note. I'm going to show you two examples of this, so pay attention. Whenever we are trading, especially mainly with the higher time frame, If you can find a higher time frame, being a 4-hour or a nice 1-hour unmitigated fair value gap price action, most of the time— just, you don't have to believe me, just look at your charts, go to the 1-minute time frame and just play the price action out, or go into replay mode, close your— you know what, I'll do that right now. I'll do it after, actually. Okay, so my point is, where should price action be most likely be drawn to? This 1-hour high, because it's a swing high. But also because it is an unmitigated fair value gap. And again, as you now know, fair value gaps are just most likely going to be tapped into. But let's do what I just said. I'm gonna close my eyes, go to a random point in the market. I can't go too far away, I'll just go right here. Okay, I have no clue what this price action is. Let me just mark something out. Okay, we have this small unmitigated fair value gap right here. And again, it's actually a good thing to know, it doesn't matter how big or how small a fair value gap is If it's an unmitigated fair value gap, you don't have to trade from it. You're just using it as a draw on liquidity. So I bet you, before we want to go to where we went up to, being this price action up here, I bet you we come down and take out these— I take out and tap into this unmitigated fair value gap. Do we have to tap into the unmitigated fair value gap? No, just most of the time we do tap into fair value gaps. So if we don't tap into this fair value gap, The chance of that are very, very low. So I think we'll come down, tap into this value gap. Okay, boom, look what happens. We came down, tapped into that fair value gap. It's not a coincidence, okay? I'm telling you what I've been doing for the past 4 years. These are very nice draws on liquidity. So of course you're not going to trade the 4-hour time frame. You can drop to lower time frames, find your entry model. Again, if you want an entry model, the links are in the bio. It's the same right here. Obviously we're looking at hindsight now, but look We have this unmitigated bullish fair value gap right here. We come up, we come up, we come up. Before we want to come up even more, we come down, tap into these unmitigated fair value gaps, and then end up coming up. And look, if we look to the left, even here, look again here, we look to the left, we have another bullish fair value gap and we've tapped into it. It's rare that you'll find an unmitigated fair value gap. We have one unmitigated fair value gap all the way down here. But other than that, it's very, very rare that you'll find an unmitigated fair value gap. Why am I telling you this, you might be asking? I'm telling you this so you understand how strong of a liquidity it can be, especially when you find an entry to it. Okay, so yeah, this is a little video on just using fair value gaps and liquidity, and also using normal liquidity. So let me show you one more example, an example that I actually used Yesterday, this is an even stronger draw on liquidity called an LFVG. Okay, um, so this is going even more advanced. So as you guys know, my strategy, I enter into a short position when I inverse a fair value gap. We've inverses bullish fair value gap. Again, I'm looking at the higher time frames to show you liquidity. So I wouldn't actually enter into a short position here because we've sapped south side liquidity And obviously we're on the 1-hour time frame, but because we have inverses 1-hour time frame, we've had string displacement. Where should price action now be drawn to, chat? So let's say again, even if you don't use my model, let's say you're using your own model and you've got a perfect, perfect entry. It can be any strategy, you can use supply and demand. You get a perfect supply and demand entry right here. You're looking at this chart, where should price be drawn to? What do you notice? We have an unmitigated fair value gap right here. Unmitigated fair value gap's on the 1-hour. The unmitigated fair value gap is on the 4-hour. Are you looking at this? You see that clearly, right? This is where price action now, in my opinion, is most likely going to be drawn to. Again, once we tap into a fair value gap, a lot of the time we'll just tap into it, fill these orders, and then carry on going up if that's where price action wants to do on the higher time frame. Let's have a look. Look at that. Price action comes down, perfectly fills this unmitigated fair value gap, and then ends up going for the highs. Okay, this is not a coincidence. I hope you found this video useful and you can start implementing unmitigated fair value gaps as a nice strong liquidity on the higher time frame, finding your entries on the lower time frame and using them as targets. You can also do it on the 15-minute time frame. Again, I'm going into more advanced stuff here. If you are finding this a bit too complex and you want me to go a bit easier on you guys, then just let me know in the comments below. If you found this video useful and want me to keep doing the content, make sure you comment— I read 100% of the comments— and subscribe. I'll be giving a funded account away to somebody who's made it to the end and type a comment with a smiley face at the end of the video, at the end of your comment. Um, yeah, thanks everybody for watching. Like and subscribe. I'll see you tomorrow for another upload. Daily uploads if you subscribe. Also, as well, of course, if you want to watch me livestream every single day or interested in my private mentorship, the results have been insane. All of the links are in my bio. I hope you guys have a nice rest of your day.
More from Louis
I lost 4,000$ Today Trading and would do it again next week... (FULL TRADE BREAKDOWN)
Losing 4,354 and i would do it again tomorrow... (80% win rate model trade breakdown)