In this comprehensive tutorial, the presenter walks viewers through the core ICT (Inner Circle Trader) concepts used by price‑action traders. He defines and demonstrates how to identify Fair Value Gaps (FVGs) and their variations—Inversion FVGs and Unmitigated FVGs—explaining why they represent market inefficiencies and how they are typically filled. He then clarifies liquidity, showing how stop‑loss clusters form trend‑line, equal‑high/low, and swing‑high/low liquidity zones, and describes a liquidity sweep as the price taking out those zones, especially when a wick penetrates and then rejects. The video introduces SMT (inter‑market divergence) by comparing correlated pairs such as NASDAQ and ES, outlining bullish and bearish SMT signals. Displacement is presented as a large, low‑wick candle indicating strong directional pressure. The presenter warns against trading during chop or consolidation, labeling it untradeable, and briefly mentions daily bias as the trader’s expected direction for the day. Throughout, he intersperses personal credibility (4‑year trading experience, large Discord community, student success stories) and promotional calls‑to‑action. By the end, viewers should be able to spot each concept on a chart and understand its typical trading implication.
Chapters
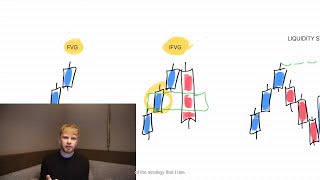
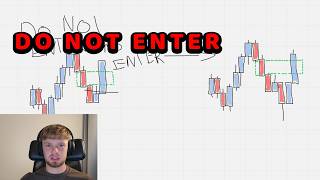
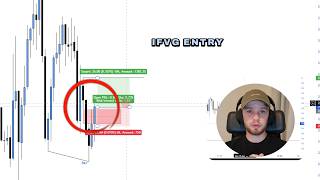
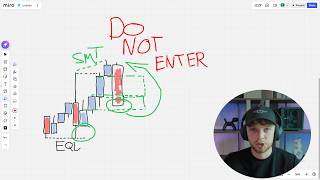
This is going to be the absolute only video that you need to watch about the different types of ICT concepts and PD arrays. So by the end of this video, you will know what exactly each ICT concept means and how you can potentially use it in the market. So you don't need to watch any other videos, and by the end of this video, you will have a full understanding on how you can really understand what these concepts mean. And starting with a fair value gap. Now, I've mentored and I teach thousands and thousands of people. I have over 38,000 members in my Discord, and I get asked these basic questions on a daily basis. So this video will have absolutely everything you need, starting with a fair value gap, otherwise known as an imbalance. So not only am I going to be telling you how to identify these in the market, I'm also going to be telling you what they are, because believe it or not, a lot of people don't actually know what a fair value gap is and why we use fair value gaps in the market. So let's start with a fair value gap. You might have heard of a fair value gap as an imbalance. So it is either a fair value gap or it is even an imbalance. They are both the exact same thing, and all it is is an inefficiency in the market, an imbalance in the market where orders have not been filled. So when you have 3 candles, from the first to the third candle, they can't touch, connect, or overlap. Okay, that is the definition of a fair value gap. So as you can see right here, we have our first candle here, we have our second candle here, and then we have our third candle here. From the first candle here to the third candle here, they do not touch, connect, or overlap. Now that can be with a wick, that can be with a body, it doesn't matter, as long as the first candle here and the third candle don't touch, connect, or overlap, that imbalance in the market is where orders are resting. So most of the time, a fair value gap will get tapped into. Now, don't just take my word for it. This video— if you don't trust my word, which I understand that you shouldn't trust my word, I'm just a random guy that you're seeing on the internet— what you should do is go to the chart and look at it for yourself. You will see that these fair value gaps, they get filled most of the time. It's not a coincidence. So that is how you identify a fair value gap. Also, a common misconception with fair value gaps is that it has to be 3 same candles. It does not. So this can be a bullish candle, this can be a bullish candle, and this can be a bearish candle, and that is still a valid fair value gap. The way you're going to identify which the way fair value gap wants to go is by whatever color the second candle is, slash the middle candle. That is where your fair value gap is going. If it's a bullish candle in the middle, it's a bullish fair value gap. If it's a bearish candle in the in the middle, then it's a bearish fair value gap. Okay, now by the way, a bit more of a backstory about me. I've been trading for nearly 4 years now, and ICT concepts have made me a stupid amount of money. And not only me, it has made my students a stupid amount of money. My students alone have made hundreds and hundreds, if not millions of dollars from trading the markets. One of my students today got $35,000 payouts. So yeah, all of the links are in my bio. I live stream daily. Okay, now let's jump into the second concept, the inversion fair value gap, something that I made very, very popular in the trading space. An inversion fair value gap is simply when we have a fair value gap like we do right here and it is disrespected. So if in this case we have this bullish fair value gap because we count 1, 2, 3 candles, the second candle we have this inefficiency, that is the fair value gap. And as you can see, if we get a bearish candle close here below the bullish fair value gap, or if we were to get a bullish candle close above a bearish fair value gap, that is what we call an inversion fair value gap. And this is actually very heavily involved with the strategy that I use. And yeah, a lot of the time when you see a fair value gap being inversed, we should go to either liquidity or we should go to an unmitigated fair value gap. An unmitigated fair value gap is simply a fair value gap like this that just hasn't been tapped into yet. Okay, so unmitigated is just a term used when we have a fair value gap that isn't tapped into yet. So that is simply all an inversion fair value gap is. It is a disrespected fair value gap. Now moving on to a liquidity sweep, something that is also very, very important. Of course, if you don't know what liquidity is, liquidity is simply where stop losses are resting in the market. So let me quickly do a little detour. This is liquidity. You have trendline liquidity, you have equal highs and equal lows, you have swing highs, swing lows. It is simply where other people's stop losses are resting in the market markets and where price action is most likely going to be drawn to. So for example, here I don't want to focus too much on liquidity. I want to focus more on the other concepts because I have lots of videos on liquidity. But liquidity, again, this is an example of trendline liquidity. So we can simply draw a perfect trendline like this here. What does this mean? This means that there is lots of liquidity resting below in the markets. Therefore, if you were to get a short position right here for whatever reason, the most probable chance that— the most probable area that price action will be drawn to is this liquidity point. If we're looking at the equal lows, for example, equal lows are when we come to the exact same point in the market more than once. This creates lots of liquidity where orders are resting in the market and where price action wants to be drawn to. Let's say that you got a short position right here for whatever reason in your model. The most likelihood of chance the most likely price action— what am I seeing right now? My bad. The most likelihood of where price action wants to go is to these equal lows in the market. Okay, simple as that. That is all liquidity is, is simply where stop losses are resting in the market. And you can find that out by finding the stronger draws on liquidity. And of course, you have swing highs and swing lows. So a swing high, we have lots of buy-side liquidity. A swing low, we have lots of sell-side liquidity. If you want a deeper dive into liquidity, I have a full video on that, so make sure you do check that out. So jumping back into a liquidity sweep, so this is an example of a swing high liquidity draw, and as you can see, when we sweep the liquidity, that simply means taking it. So that can be a wick, that can be a body of a candle. As soon as some sort of price action— so in this instance, this wick has taken out this buy side liquidity— Therefore, we have swept buy-side liquidity. Buy-side is always at the top, sell-side is always at the bottom. So for example, right here where I just drawn that yellow line, we have sell-side liquidity resting. As soon as either one, a bearish candle comes like this and gets a close below, or a wick below this point, or doesn't have to be a close, just below this point in the market, that means that we have swept that liquidity. Okay, very, very important, a liquidity sweep. And ideally, a stronger liquidity sweep is when we have a wick through the liquidity point and then we reject. That is a strong liquidity sweep. Moving on to an SMT. Now this is a bit more of an advanced technique. An SMT is simply when we have two correlating pairs, for example NASDAQ and ES, and we take the high on one pair and we don't take the high on the other, or we take the low on one pair and we don't take the low on the other. Okay, that is simply all that an SMT is. And what does an SMT mean? For example, let's say we take this high on NASDAQ but we do not take this high on ES. This means we have a bearish SMT, which is simply a divergence in the market. Now what this means is if you now get a short position after you have a bearish SMT— bearish SMT meaning when we take the highs on NASDAQ and not on ES, or vice versa, it doesn't matter which one— then That means if we get a short position after this point, the short position is more likely going to work. Okay, as simple as that. Of course, it's the opposite. Let's say we take the low on NASDAQ and we don't take the low on ES. That means that this is a bullish SMT, meaning that long positions are more likely going to work. Another trick with SMTs: the more obvious the draw on liquidity is— for example, if it is a swing low in the market then the higher chance that the SMT has of working and being valid. Another thing to note with SMTs: the high should be created at the same time, if not a minute apart. For example, if this high is at 10 AM, this high on ES should also be at 10 AM. Okay, that is SMTs. I get a lot of questions on SMTs, so make sure you do fully understand it. Now moving on to displacement. One of my favorite things to use when we are looking for a trade. All displacement is, is when we have a strong candle in one direction, ideally without much of a wick. So right here we have a very strong displacement candle. As you can see, this candle is a lot bigger than the candles around it, meaning that it is displacement. Okay, I'm keeping these videos very simple, straight to the point. There is no point overcomplicating concepts when there is no need to be overcomplicated. All displacement is, is when we have a large candle in either direction. This is a bearish candle, so this is bearish displacement. If we got a large bullish candle, that would be bullish displacement. This is what you want to see when you're looking to enter into a trade because it shows that there is volume and it shows that there is speed. Okay, simple. That is displacement. Moving on to something that you need to be able to identify is the chop/consolidation. So whenever we are chopping/consolidating, this is when price action is going sideways. You might have heard this as search and destroy. This is when price action is taking the highs, when price action is taking the lows, not taking the highs, not taking the lows. We're just literally going sideways, and this is untradeable price action. No matter what you do, you should not be entering into this price action when we are consolidating/being choppy, okay? So stay out of the chop. And again, it's as simple as that. I'm not going to overcomplicate the consolidation choppy price action. Just do not trade it. And of course, when we have clean price action or nice price action, that is when we are creating nice higher highs, nice higher lows. We're coming in, we're creating fair value gaps that we can potentially get entries from. Um, so yeah, just avoid the chop when you're trading. Nobody can be profitable trading the chop. There are also some other times I have not put into this video um, that made that— I didn't think fit very well into this video, being daily bias. All daily bias means is where we think price action is going to go on the day. So yeah, I hope you enjoyed this video. My iPad did just die, so if this video didn't save, I'll be very angry and I'll have to redo this whole thing. But if you are watching this, this means that it did save, and I hope you enjoyed this video. If you want me to keep up these videos, and if you made it to the end, comment below with two exclamation marks at the end of the message, and I'll be giving a funded away account to one of you. I'll send you a message. So yeah, if you want me to keep posting daily, also leave a comment below on what video you want me to make it on. This was more of a basic video. I can also do very advanced videos. I hope you found this useful. Let me know in the comments, all of that stuff, and I'll see you tomorrow for another video.