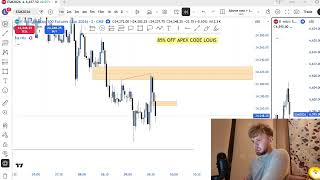
Liquidity Trading SIMPLIFIED (80% winrate)
In this instructional video, the presenter explains that market price moves are driven by the concentration of other traders' stop‑loss orders, which he defines as liquidity. He argues that mastering liquidity—understanding where stop orders rest and how institutions hunt them—allows any trader to become consistently profitable. The tutorial outlines several specific "draws on liquidity" and provides concrete rules for identifying each: trendline liquidity (minimum three touches, requires displacement), equal highs/equal lows (exact same price point touched at least twice, stronger on higher timeframes), swing highs/lows with a distinction between external (obvious) and internal (intra‑candle) points, unmitigated fair value gaps (three‑candle imbalance that statistically gets filled), and news highs/lows (high/low at major economic releases identified via ForexFactory). For each draw, the presenter describes how to use it for entries, profit targets, stop placement, and partial exits, and warns that once a liquidity point is swept it becomes invalid and traders must shift to the next level. The video concludes with promotional calls to subscribe, comment, and join the presenter’s mentorship program.
Chapters
The market does not care about your strategy. The market simply targets all of the liquidity points that are resting. And if you can master liquidity when you are trading, then you will become an exceptional trader. It doesn't matter if you are an experienced trader. It doesn't matter if you are a brand new trader. If you can understand the concept of liquidity and understand why the market moves the way that it does, then there is no doubt that you will become an extremely successful trader. So let's jump straight into this video. Now firstly, what is liquidity? The easiest and the best way to look at liquidity is to put it in simple terms. Now liquidity is simply where stop losses are resting in the market. Now this is extremely important to note because I will keep coming back to this in this video. So you must know liquidity is simply where other people's stop losses are resting. Now, this is important because remember, when you are trading, trading is player versus player. If you are making money in the markets, you are simply taking it away from somebody else who has lost money in the markets. So think about it, what do you want to do? You want to be better than every other trader that you are trading against. So if you can understand where limit orders are resting in the market, which is essentially liquidity, then you'll be able to see where most traders are getting stopped out, because that's where the strongest strong liquidity is, then ultimately you can profit from that. So the best way to think about what liquidity is is by thinking, thinking it as other people's stop losses. Okay, extremely simple but extremely important. Now, why price hunts liquidity? And by the way, of course I'm going to be going over how you're going to identify with the liquidity, just make sure you keep watching this video. This will be the— this will seriously be one of the most important YouTube videos that you ever watch on trading. Now, why does price hunt liquidity? This is also very nice to know. Why does price potentially target the liquidity? Now, I kind of just touched on it, but ultimately liquidity is where stop losses are resting. So when you have people that want to place big orders, when you have these banks and these institutions that want to enter into the market, they cannot just enter a buy position or a sell position like we can. They need to grab liquidity from retail traders and then use that liquidity to get in the market. So let me give you a live example. So as we can see, we have all of these stop losses which are swing lows in the market right now. Let's say a big bank wants to enter in— into a position and they want to enter into a long position. And let's say price action is right here where I'm drawing. What the banks would need to do is come down, take out this liquidity that is resting in the market, Then what they can do is now they have liquidity to enter. So here they can enter into long positions. But of course, it's not that simple. You can't just enter any positions when a liquidity point is swept or a strong draw on liquidity, because it's simply not that simple. What banks also like to do is trick people. So you have trendline traders, you have the supply and demand traders. This is where they are compromised. Let's say we had this low, this swing low in the market, right? Price comes down, takes this low. Now what people are thinking, who think they know about liquidity, is, oh, price has just swept this sell-side liquidity, now price action must go up. And that is simply incorrect. Price action has a very, very high chance of then coming straight down. So ultimately, you cannot just trade liquidity. You need a concept behind, and you need to use liquidity as context. But liquidity Liquidity is the strongest context that you will ever use when trading, okay? It's extremely important. Now, I've actually wrote this wrong. I was meant to delete that. But you have liquidity drawers, okay? You have trendline liquidity. Well, to be fair, that's not far off, but you don't want to necessarily rank liquidity, so don't worry about weakest or strongest. But right here, these are just the different types of liquidity, and I'll be going over each one specifically. Now you have trendline liquidity, you have equal highs and equal lows, you have swing high, swing lows, you have unmitigated fair value gaps, and you have news highs and news lows. In my opinion, these right here on the screen are the most important liquidity points that you need to make sure you understand, and you need to make sure you understand them well when you are trading. Okay, so let's start off with trendline liquidity. Now trendline liquidity is simply when you can draw a trend line. As you know, there are some trend line traders, trend line traders out there. So we are trying to exploit the traders. Every single time you can see a perfect trend line— now with a trend line, ideally you want a minimum of 3 touches. So 1 touch here, 2 touches here, 3 touches here. You need a minimum of 3 touches to identify trend line liquidity, okay? Once you have these 3 touches, then all of this area below is where price action has sell-side liquidity. We call it sell-side liquidity because it is where buy stops are resting. For sell stops, it's buy-side liquidity. So let me just put that in simple terms for you. Let's say that this is a chart. All the liquidity resting above is buy-side liquidity. All of the liquidity resting below is sell-side liquidity. So if you ever hear me refer to those terms, then that is all that it means. Extremely important to note as well. So of course, trendline liquidity, stop losses resting below this trendline liquidity. Now going a bit more advanced into trendline liquidity, whenever you have trendline liquidity resting in the market, ideally you want to see it swept and you want to see it swept quickly and with displacement. Displacement simply means a large moving candle, okay? This is because if you don't sweep trendline liquidity with a larger candle, then a lot of the times you can just slightly adjust the trendline and there will still be trendline resting there. So ideally, when we swipe or sweep the trendline liquidity— and sweep simply means take or go below the sell-side liquidity point in the market— then that is taken. Okay, so yeah, you want to see displacement and you want to see a fast move. So that is exactly how you're going to identify trendline liquidity. And of course, it is the exact same if you have a buy side trendline liquidity line. Now we have equal highs and equal lows. In my opinion, these are my favorite draw on liquidity. Now what I must note about liquidity in general— I specifically want to use equal highs and equal lows as an example here— is that a lot is that the different time frames that you are using can affect the strength of liquidity. Because of course, sometimes you're going to have strong draws on liquidity, and sometimes you're going to have weaker draws on liquidity. Every single candle that you are looking at here is technically a liquidity candle, but of course, a lot of the liquidity is irrelevant. Now, the way that you're going to identify the stronger draws on liquidity are by firstly using everything that I'm mentioning on this video, and Secondly, by using the different time frames. Now, when you have a draw on liquidity on the higher time frame, then it is simply always going to be a stronger draw on liquidity. For example, if you have a— let's say you have daily equal highs, they are a lot stronger of a draw on liquidity than if you have 5-minute equal highs. Now, the 1-minute time frame is extremely incredible to use when trading, and I use it most of the time when I'm looking into my entries. And equal highs on the lower time frames are probably one of, if not my favorite, draw on liquidity, just because how consistent they actually are. Now, to identify equal highs in the market, you simply have to find the exact same point that has been tapped into at least twice. It has to be the exact same point. So right here, as you can see, we have this wick reaching this point in the market. and then we have this, this wick here which has came after, reaching the exact same point. The reason why I'm emphasizing the exact same point is because sometimes you can have a candle that is slightly off by a few ticks or a few points, and that is not technically equal highs or equal lows. So that's very important. And again, going back to the same point, above this right here is simply where loads and loads of stop losses are resting. So let's say, for example, you entered into a long position for whatever reason right here. The logical place where you should target as your take profit point should be these equal highs because they are the strongest draw on liquidity around, okay? Very simple. And liquidity is just where price action wants to be drawn to. Now of course you have the flip side, equal lows. So again, price action has came here, then prices came to the exact same point there as well and tapped twice. Now, of course, below we have sell-side liquidity. Let's say that you're going to enter into a short position here. Where do you want to target? You want to target this sell-side liquidity. Extremely important and extremely, extremely useful. Now we have the most common draw on liquidity: swing highs and swing lows. And I'm going to go more in depth also about internal liquidity. So you have in— let's just call it internal, INT, internal liquidity, and you have external liquidity. Okay, the difference between internal and external liquidity is this: your external liquidity is going to be all of your obvious, obvious swing highs and swing lows in the market. Okay, so for example, this, this is an external liquidity low, this is an external liquidity high. Now, as I mentioned, every single candle is technically a liquidity candle. So all of the internal liquidity points are— they are going to be the points like this is an internal liquidity low, this is an internal liquidity low. So yeah, this is an internal liquidity high, um, that is an internal liquidity high. Okay, the reason why I'm mentioning this is because as you go deeper into trading, you can use the internal liquidity points to, let's say, maybe move your stop loss to break even at that point in the market, or take partials at internal liquidity points. So it's extremely important to note the difference between internal and external. Now, of course, external is always going to be your obvious draws on liquidity, and they are always going to be stronger draws on liquidity as well. So now, swing highs and swing lows, again, they are simply all of your swing highs and swing lows, and there's just liquidity below and above that point in the market. Okay, so a swing high is obviously when you have a higher high in the market, for example right here. Then what does this mean? Above this point we have buy side liquidity. A lot of the— this is the most common draw on liquidity as well because we're always going to have a swing high and a swing low. Now we have the sell side liquidity point, swing low. Same again, there's always going to be sell side liquidity resting behind here, and this is always your safe bet of liquidity points because you're always going to find a swing high and a swing low. Now you have the unmitigated fair value gap. This one a lot of people don't use enough, and I think it is extremely important. Firstly, if you don't know what a fair value gap is, it is simply a 3-candle pattern formation where the first candle and the third candle don't touch, connect, or overlap. Okay, now all a fair value gap is is simply where orders are resting that have not been filled yet. You might have heard it as an imbalance. Once you have an imbalance on the market, we create this fair value gap. Now, statistically talking, most of the time fair value gaps will get tapped into. That is a fact. If you go and look at your chart, you will see that once we create a fair value gap exactly like this most of the time it will get tapped into. But why would it get tapped into? It will get tapped into because there is liquidity there, there is orders there that have not been tapped into yet. Therefore, we want to fill those orders. So the way that you are going to use unmitigated fair value gaps is when ideally you don't have another specific target that is close by. Now what I mean by this is sometimes you will get an extremely large move down when you are trading, okay? And when you get this extremely large move down, you'll— oh, what? I just clicked. When you get this extremely large move down— oh no, oh no, we've had a malfunction. Okay, so when you get an extremely large move down when you are trading, then a lot of the time you're going to create unmitigated fair value gaps. And of course, let me just draw this out so it's easier for you to understand. Let's say we have a massive, massive drop in price action like this, and then price starts to consolidate here. Let's say then you find a perfect long position. If you get a perfect long position here, for example, and you enter right here, you might be thinking, okay, where do I target? Because these swing highs are maybe 200 points away, so it's hard for me to target this high. Then what you're going to find is you're going to have unmitigated fair value gaps here along the way, which you can target. And remember, the higher the time frame, the stronger the draw on liquidity. Still statistically unmitigated fair value gaps and fair value gaps in general get tapped into. And by the way, all unmitigated means is simply a fair value gap that has not been tapped into yet. That's all an unmitigated means. So yeah, the liquidity draw would be when we mitigate this fair value gap. So that is the way that you're going to use unmitigated fair value gaps as draws on liquidity. I must say they're not necessarily as common as your equal highs, your swing highs, but they are extremely useful. Now, news highs and news lows— this is the strongest draw on liquidity, I would say, tied with equal highs and equal lows. Yeah, so news highs and news lows. Now, if you made it this far in the video, Firstly, well done for watching this far. Most people statistically do not make it this far in the video. Make sure you subscribe and comment below so I know that you've made it this far. Also, if you want to get one-on-one mentored by me, the links will be in the description. Simply send me a message on Instagram. I reply to absolutely everybody on that. Now, news high, news low is simply when you go to forexfactory.com. Now let me load this up for you and I'll show you a live example. When you go to forexfactory.com, it will look like this, the website. Let's say we go to Tuesday because I know we have red folders on Tuesday. You're going to see this, and now with this you're going to find a red folder. As you can see right here, this is a red folder. The red folder is USD. That is exactly what you want to see. So you'll have Canadian news, you'll have English news, you'll have all these different countries' news, but you want to find the USD news. Now next to it, it will say a time. So for example, on Tuesday the 9th of December, we have Redfold News at 10 AM New York time. So we go to the markets, we go to the 1-minute time frame. At 10 AM on that time of day, we are most likely going to get a large moving candle. This normally appears when we have bigger news like CPI, NFP, PPI, or FOMC, okay? But it can happen on any red folder news. So when we have this red folder news, you go to the 1-minute time frame, and then on that time— on that time that the news is created, you mark out that low as the news low, and you mark out that high as the news high. Now again, statistically talking, this is straight facts, most of the time the news high and the news low will get swept. So again, what does this mean when you're trading? Let's say you get a short position right here. If you entered into a short position here, where would you want to end? Where would you want to target? You'd want to target this news low as your draw on liquidity. As you can see, this is a nice mini swing low. This would be your internal liquidity point. So here are two examples of some very nice draws on liquidity and how you can actually use it when you are trading. But again, statistically talking, the news highs and news lows they get hit most of the time. So as you can see here, the news high got hit, now the news low has got hit, and this is just an extremely strong draw on liquidity. Another thing to note with liquidity is that once the high is swept or once the low is swept in the market, you can no longer use it as a draw on liquidity. So right here, as you can see, we have swept this news high. So now this news high is invalid if we were looking for a buy side liquidity target. We would now have to use this swing high because the news high has been swept. Same for the news low. This news low has now been taken right here. Therefore, if we were looking for sell-side liquidity, we cannot now use that. We could not use that news low now because it has been swept and taken. I hope you found this video useful going over some of the draws on liquidity when trading. If you like this style of content, let me know and I will keep pumping it out for you. I'm trying to be as educational as possible and help a lot of you guys out. So again, if you want to join my mentorship, the links are in my bio. It's nearly the end of the year. Make sure you're taking action, and I will see you very, very soon. Let's go.
More from Louis
I lost 4,000$ Today Trading and would do it again next week... (FULL TRADE BREAKDOWN)
Losing 4,354 and i would do it again tomorrow... (80% win rate model trade breakdown)