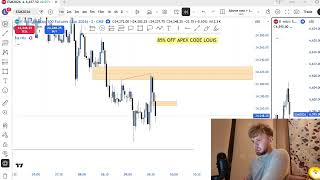
This ICT Strategy Is Boring, But It Made Me A Profitable Trader (FULL GUIDE)

Kai Davis teaches his Inversion Fair Value Gap system for day trading, claiming an 80% win rate. The strategy uses three-candle patterns called Fair Value Gaps, inversions that signal reversals, and liquidity sweeps to find high-probability entries during NY market hours 9:30-11am and 2-4pm.
Chapters
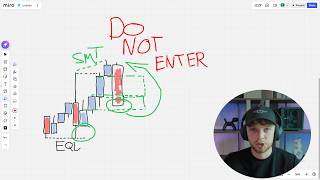
In today's video, I'm going to be showing you a strategy that has over an 80% win rate and has made me a stupid amount of money every single month on a consistent basis. This strategy is very reliable and consistent, and the best part is you don't need to use any trends in the market. And in this video, I'm going to be showing you exactly what you need to look for and some live trading examples. So make sure you watch the video all the way to the end because you will find this very useful and and you will have an 80% win rate model by the end of it. So let's jump straight into the charts. So I have been trading for over 4 years now. I have been through hundreds of strategies, and this strategy that I now use, my Inversion Fair Value Gap model, is the best one that I have ever used, and it has the highest win rates in the market. It is also the simplest strategy to use, so you really cannot beat this trading strategy. It is just extremely simple and a very high win rate. And what more do you want when you are trading? This is the same strategy that has helped me go from making £2,000 or less every single month working a job that I did not enjoy to now living my dream life, living in Dubai, flying my family to places that we can go to every single day. Right now I'm literally in LA. I'm not even in Dubai right now. I'm in LA for a few weeks and it is literally all because I locked in, I learned how to trade, and now I have this amazing, amazing strategy. And you can do literally the exact the same. You just need to learn how to do the strategy. So let's jump into what this strategy is, the Inversion Fair Value Gap model. It includes fair value gaps and liquidity. This is the two main points that you need to understand if you want to use this model correctly, okay? First of all, so I'm going to be showing you exactly what a fair value gap is and how you are going to use it. So let's jump right into it. All a fair value gap is is simply a 3-candle pattern formation where the first candle and the third candle don't touch, connect, or overlap. So as you can see right here, we have a bullish fair value gap. How do I know that this is a bullish fair value gap? I know that this is a bullish fair value gap again because this candle in the middle is a bullish candle. For example, we have 3 candles here: 1, 2, 3. Let's say that the second candle was a bearish candle. That would make this a bearish fair value gap. Now, a common misconception when it comes to fair value gaps is that all 3 candles need to be the same, and this is simply incorrect. As you can see right here in this example, we do have 3 bullish candles, and this is a bullish fair value gap. But if we actually look to the right here, we can see a different type of fair value gap. We have 1, 2, 3 candles. The first candle here, the wick, to the third candle of this wick don't touch, connect, or overlap. So right in this gray area, that should be a fair value gap. And as you can see, this first candle is a bearish candle, then the other two are a bullish candle. This doesn't affect the fact that it is still a fair value gap. And as you can see, this second candle, being the middle candle, is bullish. Therefore, this is a bullish fair value gap. Now right here, what I actually have drawn on, on the charts is not just a fair value gap. This is an inverted fair value gap. So what that means is we have had a bearish candle close below a bullish fair value gap in the market. That means that we have inversed this bullish fair value gap, and now the highest chance of where price action is most likely going to go— and why an inversion is used is because now we've got this bearish candle close below this bullish fair value gap— price is most likely going to go to one, either an unmitigated fair value gap, which just means a fair value gap that has not been tapped into yet, or a liquidity point. Now, on the right, this is a liquidity example. So every single candle and every single point of a market is technically liquidity. What liquidity means is simply where stop losses are resting in the market. What a liquidity sweep is, what we'll be using in our strategy, is simply when price action comes through the liquidity point, then goes in the opposite direction. For example, right here we have a swing high. This swing high is liquidity. The reason why this is liquidity is because most people put their stop losses at swing highs and swing lows in the market. As you can see right here, price action has came up, swept this buy side liquidity— buy side liquidity because it is at the top— and then we've got a rejection from this point. This rejection being this sweep on liquidity, and this is what we are going to look for when we are trading. And I'm going to show you live example in the future, so keep watching. Remember, if you have any questions, leave it in the comments below. Moving on, before we jump into the rest of the strategy, I've been trading for over 4 years. I've literally been live streaming my trades every single day for around 2 years now. I have not missed a day live in the markets trading. So if you do want to watch me trade live, then of course all of the links are in my bio. But let's jump straight into the different times that you should trade and shouldn't trade, because this is very, very important. I was— I'd done this at the start when I first started trading. I thought that I could jump on the markets and trade every single second of every single day. And ultimately, as much as you think trading more will make you improve, this will only slow your progress down. So the first thing that you need to know is that the only times that you should be trading is either from 9:30 AM New York time to 11:00 AM New York time. This being the New York AM session, or the PM session, which is from 2 PM New York time to 4 PM New York time. Trade these two times of the day. Do not trade any other times of the day because they are simply lower probability and have less volume. Less volume simply means there is less people trading and the candles aren't as strong as they should be, which ultimately means we are in lower probability market conditions. Okay, so this is very important. You need to know when to trade. You can't just trade every single second of the day. Now, our first step is identifying daily bias. So I do not use buy trends, and I don't use sell trends. I don't use bullish trends or bearish trends. As you can see, your average trader would look at the price action and look at this, this chart right here and say, cool, we're in a bullish trend right now. I do not do any of that. And what I'm actually going to be showing you is a live example of how I would find my daily bias. All daily bias means is simply where I think price action is going to go on that day. And why. It's very important. For example, a few key tips as well: if price is at all-time highs when you are trading, then your bias should automatically be bullish. If we're at all-time highs, you should be bullish unless you have a strong reason to be bearish. A common mistake that a lot of traders make is just because we have swept liquidity, being the previous all-time highs, your daily bias should now be bearish, and that is simply incorrect. So let's look at a live example of daily bias. So if we jump into the chart right here, this is the daily chart, or let's say that this is the daily chart. As you can see, your average trader would think, okay, we are clearly in an uptrend right now because we're creating a higher high, higher low, higher high, higher low, and we are simply coming up. And your average trader would only be looking for long positions in this current situation. But what I would do as an inversion fair value gap trader is I would note that there are fair value gaps in the market So as you can see right here, we have this bullish fair value gap. The reason why this is a bullish fair value gap is because we have a 3-candle pattern formation. Let me zoom in a bit more so you can see it. We have a 3-candle pattern formation, 1, 2, 3, where the first candle and the third candle has not touched, connect, or overlapped with the first candle. So therefore, this gap in the middle is our fair value gap. And a quick side note, a fair value gap, otherwise known as an imbalance, is simply where orders are resting in the market that have not been filled yet. Okay, so very useful to know. And as you can see right now, this price action is currently respecting this bullish fair value gap. So like I said, just if we don't have a reason to be bearish and we're at all-time highs, then be bullish. But if we look at our next candle, as you can see, we have swept and we have inversed, meaning we've had a bearish candle close below this bullish fair value gap. So what this now means is Because we've got a candle close below a bullish fair value gap, price should now do two things. Either one, come down and take south side liquidity, or two, tap into an unmitigated fair value gap. Because we do not have an unmitigated fair value gap and we have this nice internal swing low right here— remember, this is where liquidity is resting because most people's stop losses are resting below this point in the market— and as you can see, we have no unmitigated fair value gap. We only have this liquidity point. So now most people are going to be bullish because we're in this clear uptrend, but we don't use uptrends, and now we would target this sell-side liquidity in the market. And as you can see, price perfectly ends up coming for this sell-side liquidity. So let's jump straight back into the presentation. And that was just a live example of how I find my daily bias. Step 2: liquidity plus inversion for our value gaps. We're looking for the following patterns in the market. So what is a liquidity sweep? I explained this a bit earlier in the video, but price is simply when we go above a recent high or below a recent low, then that means we have swept the liquidity. Okay, ideally you want to see a liquidity sweep on the 1 to the 5-minute, the 15-minute time frame, the 1-hour, or the 4-hour. Okay, that's the most common time frames that you're going to use liquidity sweeps, mainly from the 1 to the 5-minute. That's where I find the literally most of my liquidity sweeps. Next, an inversion fair value gap. Like I mentioned earlier, an inversion fair value gap is simply when we get a bearish candle close below a bullish fair value gap in the market, okay? That is simply an inverse of a fair value gap, and obviously the opposite for a bearish fair value gap if we got a bullish close above a bearish fair value gap. Very simple. Now, this is what happens when you pair the two. As you can see right here, we have swept sell-side liquidity. This candle has went below sell-side liquidity, and then we have perfectly rejected and burst this bearish fair value gap, and then prices came to the next liquidity point. One thing that I also must mention is you don't need to only have a wick of a candle to take liquidity. It can be a full candle close below this point in the market, and that is still a valid liquidity sweep. Okay, so keep that in mind when you are trading. So Step 3, you need something called displacement. This is very, very important and underrated. It's extremely simple to find and not enough people are using it. All displacement is, is simply when we have a large candle that goes in either direction. It is literally that simple. And the amount of winning trades that I've caught because of displacement is stupid. Literally, as you can see right here, we have some candles, we slap buy side liquidity, then we get this large candle. This tells us that there is lots of volume in the markets, and if we get a displacement candle combined with a liquidity sweep and an inversion fair value gap targeting liquidity, then it is stupidly high win rate. And that is all displacement is. And of course, this is an example of what displacement looks like. This is a bearish candle displacement. It is the exact same if we get a large bullish candle. So moving on to step 4, the different types of entries that you can have. So right here, as you can clearly see, we have swept southside liquidity. Prices came down below this point in the market. We've also tapped into a higher time frame fair value gap. That is what that blue box is, because that is going to be extra context. Okay, when I say context, all that means is reason why you would enter into a trade and reasons why you would not enter into a trade. You have to weigh them up, because as much as people tell you online You can't be a robot when you are trading. If trading was extremely, extremely easy, then there would just be robots who could do it all for you, and there is not, okay? You can't buy a robot that can teach you how to trade and make you loads of money. And if you did find one, you would be a billionaire, okay? So example right here, we've swept sell-side liquidity from this wick. As you can see, prices came below this candle, we've swept it, we've created this bearish fair value gap. Price action has then came up and burst this bearish fair value gap in the market. So now where should price action go? Price action should go to either an unmitigated fair value gap, which again means a fair value gap that we have not tapped into yet. And as you can see in this price action here, there is no unmitigated fair value gaps. So price action should be drawn to the next liquidity point. Up here is our next liquidity point. And what is also very important to note is when you are trading this model, don't take any trades less than a 1:1 risk to reward. Every single trade that you take should be above a 1:1 risk to reward. Of course, you want to aim for the 1:3 risk to rewards, the 1:2 risk to rewards, but nothing less than a 1:1. Okay, and these are some of the things what not to do and what not to look out for. So don't trade outside of the window. So don't trade out of the times that I told you. Don't enter without a sweep slash an SMT. So I haven't actively mentioned what an SMT is yet. All an SMT is is simply when we take a high or a low on one instrument but not on the other instruments, okay? So for example, when you are trading, you need to look at two charts. You need to look at NASDAQ and ES, or two correlated pairs. Let's say that we have a high created on NASDAQ at 10 AM and we have a high created on ES if we swipe that high on NASDAQ and we don't take that high on ES, that is an SMT. Okay, so sometimes, for example, let's say that this high right here, this candle, is a low on NASDAQ. And as you can see, we've swept on NASDAQ, but if we were to look at the ES chart, we would have the same low that we have not swept. This would then be called a bullish SMT. And the reason why this is important is because sometimes you might not actually sweep the liquidity on NASDAQ but we might have a very strong SMT, meaning that you can still take the trade. But of course, having a nice sweep on liquidity is always very, very nice to have. And by the way, I do have some more YouTube videos on my channel that explains all of these basic terms like consolidation, SMT, fair value gaps, liquidity, if you want a bit of a deeper dive. Now, some of the things that you shouldn't do: over-risk. If you over-risk, you will never become profitable. It's as simple as that. You can find out the hard way, or you can find out by listening to me. And of course, consolidation— if you trade in consolidation when price is simply going sideways, you will never become profitable. Okay, now let's give you a real-life trade example of one of the trades that you could take in the markets. So I'm actually going to use this example right here in the markets because it's extremely perfect for what I've described in this video. Now remember, to Time is fractal. So even though this is actually the higher time frame which I'm sharing this on, the exact same thing that you need to look for on the higher time frame, being your daily bias, is also the exact same thing that you need to look for to get your right entry model on the lower time frames. Okay, so right here, as you can clearly see, we've had the sweep on buy side liquidity. We have taken out this buy side liquidity, and we also have this bullish fair value gap in the market. This is a bullish fair value gap because it's 3 candles that the first and the third candle doesn't touch, connect, or overlap, and we have an imbalance. We have filled this imbalance out, but we are still respecting this fair value gap. And because we've had this buy side liquidity sweep and now we have this bullish fair value gap here, if we actually look at the next candle, we get this bearish candle close below this bullish fair value gap. So now this is where you can enter into a short position Now my stop loss is only if I get a candle close back but above this inversion fair value gap. I'll have a maximum stop loss set for worst case scenario, but 90% of my trades I manually exit once I get a bullish candle close above the fair value gap. And then you simply target sell side liquidity. This would be your first take profit point because we don't have an unmitigated fair value gap below. This is— will be our target, and this is above a 1:1 risk to reward. So this is where you can target then you can always leave a runner for lows on the market. And it is as simple as that. If you want to fully learn my 80% day trading strategy, then all of the links are in my bio. There is some more context that you need to have to create the highest quality setups in the market. But in this video, this was a perfect example of some of the more basic trades that you can look for. And don't just take my word for it, go in the market and look for yourself see how good this strategy is with fair value gaps liquidity. And then all of the links are in my bio to join my one-on-one mentorship, my full trading course, and I live stream every single day. I hope you enjoyed. Make sure you subscribe, and I will see you in the next video.
More from Louis
I lost 4,000$ Today Trading and would do it again next week... (FULL TRADE BREAKDOWN)
Losing 4,354 and i would do it again tomorrow... (80% win rate model trade breakdown)