WARNING : this video may cause you to become a profitable trader
Kai Davis teaches retail traders to profit by trading New York session hours and using fair-value gaps and liquidity sweeps instead of trend-following. He explains how displacement candles signal entries, and why exiting when price re-enters the original gap beats fixed stop-losses.
Chapters
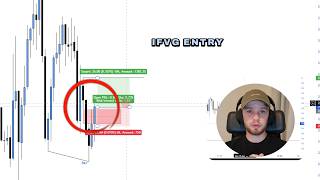
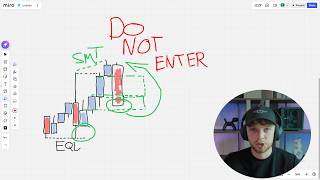
Warning, this video may cause you to make $6,433 on your next trade. Now in this video, I'm going to be talking about some of the most important things that you need to use and steps to figure out how to learn and understand an amazing strategy. What are the concepts that you need to use? What are the concepts that you don't need to use? When do you need to trade? And overall, just very, very important information. So so you can become a very extremely profitable trader. I've been trading for 4 years. I have over 48,000 members in my Discord. I livestream in the markets every single day, and these are some of the main tips that you need to incorporate into your trading strategy if you really want to make it. So let's jump straight into the video here. Now, when is the best times to trade during the day? As you probably know, if you haven't found out yet, you will find out if you don't listen to me, you can't trade 24/7 in the market. This is a big mistake that I made, especially when I first started, started to trade. You need to trade specific times, and these specific times are where the most volume is. Now, starting with the best time of the day to trade, that is from 9:30 AM— this is New York time— 11 AM, okay? From 9:30 AM to 11 AM New York time, this is when the New York market opens. This is simply when there is the most volume in the market. So this is simply the best time to trade. Then you have the second best time to trade. You have 2 PM till 4 PM. This is New York time, okay? So all the times I'm talking about are New York times. This is AM and this is PM. Okay, so 2 to 4 is a New York PM session. Don't trade after 4 PM because the markets are closed. And then the third best session to trade, and in my opinion this is for a bit more of the experienced traders, but there is still some very nice volume in the markets, is from 11 AM, 11 AM till 12. Okay, this is what we call lunchtime macro. So from 11 till 12 This is where you can get some very nice trades, but at the same time you can get some slower price action. So that is why, in my opinion, this is the third best time to trade. And other than that, I don't really recommend trading London. I don't recommend trading Asia. Of course you can trade these times of the days, but to become the most profitable trader possible, then stick to these exact times of the day right here and watch how much volume you're going to be trading with. It will help you so much. Now jumping straight into the strategy, first of all, your daily bias— you should not be using trends, okay? When somebody draws out a chart like this, this doesn't mean that price action should keep coming up right here. This is just a myth, and this is what loads of people teach you incorrectly. Yes, when we're going up like this, your daily bias can be bullish, but your daily bias should never be bullish just because we are in an uptrend. Now, all an uptrend is, so you understand what it actually is and what not to do, is when price creates a higher high, a higher low, a higher high, a higher low. It's very simple stuff. I'm sure you've seen it before. Trend lines and just being bullish because we're in an uptrend or a downtrend, it's just not what you want to be doing. It's the same with a downtrend. If you see a downtrend like this in the market, this does not mean that you should be only looking for sells, okay? Okay, that is irrelevant. What you should be doing is using your daily bias and using fair value gaps and liquidity. Okay, so first of all, what actually is a fair value gap? A fair value gap is simply when we have a 3-candle pattern formation, something that looks like this. Imagine that these are candles where the first candle and the third candle do not touch, connect, or overlap whatsoever. So as you can see right here, candle number 1 and candle number 3 do not touch, connect, or overlap. This can be the wick, this can be the body. This wick of the first candle does not touch or connect with the wick or the body of the third candle. Therefore, this little gap in the market is what we call the fair value gap. You might have heard of this as an imbalance, and this simply means where there are lots of stop losses resting in the— sorry, that does not mean that. This simply means that there is lots orders that haven't been filled yet. So a fair value gap is simply when we have lots of orders that haven't quite been filled yet, and most of the time a fair value gap will get filled. Okay, so you need to know what a fair value gap is to understand your daily bias. And the next thing that you need to understand is a liquidity sweep. I'll be talking about that later in the video. But yeah, so on the higher time frames, price— imagine that this is the daily time frame, okay, and you zoom in and you see some candles. Let's say that the uptrend looks like this. So just imagine that these candles are right here. The uptrend looks something like this. Your daily bias is going to be bullish unless you have a nice reason to be bearish, especially at all-time highs. So if we get a bearish candle close below a bullish fair value gap— so this is a bullish fair value gap. The reason why it's a bullish fair value gap is because the second candle is bullish. That's how fair value gaps work. If this second candle right here was a bearish candle, then it would be a bearish fair value gap. So because we have got a bearish candle close here below a bullish candle and a bullish fair value gap, this now means that price action should most likely come down because we should take out either liquidity or we should tap into an unmitigated fair value gap. An unmitigated fair value gap is simply fair value gaps that we have not tapped into yet. Okay, so use daily bias and get used to using a daily bias instead of using trends. Very very important. Now moving on, be patient during choppy price action. If I could tell you one thing, it's literally this is what is going to make you profitable, okay? As annoying as it sounds, you can learn every strategy in the world, you can become— you can think that you're becoming the best trader in the world, but if you're not being patient during choppy price action, then you're never ever going to make it, okay? Anybody can catch a winning trade. It's not hard to catch a winning trade in the market. Absolutely anybody can do it. But not what everybody can do is stay out of the losing trades. That is so much harder than catching a winning trade. And when price action is doing something like this on the higher time frames or on the lower time frames, this is chop, this is consolidation. We are in a range. Do not trade this price action, no matter how good of a trader you think you are, okay? It is simply unprofitable price action, and me saying this will— that will save you a lot of money if you listen. If you don't listen, then you'll figure out this the hard way, okay? Nobody can become profitable trading this chop. Now, understanding liquidity and understanding liquidity sweeps. So there are 3 main types of liquidity in the market. First of all, you have swing highs and swing lows. Secondly, you have equal highs and equal lows. And thirdly, you have something called trendline liquidity. Okay, so let me just draw them all out for you. There we go. So boom, starting off with this right here. This is actually what we call swing highs and swing lows. First of all, let's explain what actually is liquidity. So liquidity, liquidity right here is simply where people's stop losses are resting in the market. And this means price action most likely wants to go and target these draws on liquidity, so then we can either, one, carry on, carry on going in that direction, or two, come in the opposite direction because we have taken these stop losses, we have taken this liquidity, and that allows a lot of people to enter. Because at the end of the day, the markets may move either, one, because we take out liquidity Liquidity, therefore the big institutions are entering trades in the opposite direction. Let me put it another way. Let's say that this is— let's say that this is a trend line, right? This— imagine that this is a perfect trend line. Price has tapped this trend line 5 times right here. Well, 4 times. 1, 2, 3, 4. Price action has tapped this trend line 4 times. What does that mean? When this price comes down and taps this trend line again, what the average trader is now looking for long positions, right? What does that mean? Their stop losses is resting below this point in the market. Their stop losses, they're putting it at this trendline liquidity. This means that we are creating so much liquidity because there are so many stop losses. And what price action is then most likely going to do is come down, take the liquidity out from all of these people that entered long, and then boom, then price is going to go to the targets, and then price is going to go where it originally wanted to go to. Okay. So that is liquidity in a nutshell. So hopefully you understand that analogy. And so yeah, that is trendline liquidity. Trendline liquidity is simply when you can draw a perfect trendline— imagine that that is straight— and there are stop losses resting below that point in the market simply because there is lots of stop losses there. The second draw on liquidity that you have is swing highs and swing lows. So simply you draw out a swing low that there is lots of sell-side liquidity resting below. Sell-side liquidity, sell-side liquidity is simply liquidity that you would find when you're entering into sell positions. And buy-side liquidity is simply liquidity that you'd be targeting when you're entering a buy or long positions. Okay, so at the top you have buy-side liquidity, at the bottom you have sell-side liquidity. Right here, this was buy-side liquidity, but as you can see at it has been swept right here and it is no longer valid. And then to the right, we have my favorite draw on liquidity, being equal highs and equal lows. This is an example of equal lows. Equal lows are simply when price action comes to the exact same point in the market more than once. There is so much liquidity built up here, and there again, there's lots of stop losses resting below here. So let's say that you entered into a short position for whatever reason, Where would you be targeting? You would be targeting these equal lows because they are an extremely strong draw on liquidity. Okay, very good. Moving on to displacement now. Oh my God, I'm dropping some gems in this video. Displacement— this is one of the— this is one of my favorite candles to use, especially when I'm looking to trade. So again, imagine that this is— let me just explain what displacement is. So all displacement is is simply when you get a big or fast large moving candle in one direction. So let's say that this is a green candle. Let's just change the size. Let's say that this is a bullish candle. This is a bullish candle. This is a bullish candle. And then let's say that this is a bearish candle. As you can see, this candle right here is a lot bigger than these candles right here. Therefore, this is what we call displacement, okay? Displacement is simply when we have a big candle moving in one direction. That is an example of a bearish displacement candle. And then of course you can have the complete opposite. If price action is looking like this, boom boom boom, and then we just get a big candle— okay, sorry, that's not that big— you get a big displacement candle. That is simply what displacement is. Now the reason why displacement can be so important when you are trading is is, again, I don't want to focus too much on my model in this video, but let's say that you are trading with whatever model. For example, my trading strategy, I enter when we get a bearish candle close below a bullish fair value gap. This is a bullish fair value gap right here, and as you can see, we've got this big displacement bearish candle close below it. So because we've embarrassed this candle with displacement, the trade has a much more likelihood of working. Whereas let's say that we had price action moving like this, as you can see it's very slow, and let's say we invest a fair value gap there, it's not very likely to work. But let's say we had a fair value gap like this here and price action went like this. Do you see the displacement? And which price action would you rather trade? Again, imagine that these candles are lines. You'd rather trade the price action on the right where you see displacement. Okay, that is very, very important. And displacement can make you so much money, especially with if you have a nice breakeven point. Fair value gaps— I've just explained fair value gaps previously. And always enter into a clean setup. This comes back to the point that I said earlier. Do not enter into the low quality and the setups that you can win, but it's not a very good setup, okay? So many people enter into bad winning trades. You're not going to become profitable if you enter into bad winning trades. Excuse me. You're only going to become extremely profitable if you can understand the difference between a bad trade and a good trade. You can understand that you can take a good loss, but you need to understand that you can't get in the habit of taking bad wins. This will not make you profitable. And yeah, you simply need to just get out of the habit of trying to take bad trades and try and enter into the clean setups. This simply choose just the better setups in the market. And then boom, know where to place your stop loss. Another very important lesson that you need to learn to become a profitable trader. The way that I personally use my stop loss— again, let me just go back to my analogy of Fab Eye Gaps being embossed, because I use my stop loss a lot differently than most people because I don't actually set a stop loss. Now this will confuse a lot of people. So boom, let's say that these are bullish, bullish, bullish, 3 bullish candles. This is a bullish fair value gap, and then we get a bearish candle below this bullish fair value gap. So this is where I enter into short positions, right? I enter into short positions because we inverse this fair value gap right here. It's not very good. What on earth have I drawn here? What on earth have I drawn here? Let me reload this up. Okay, yeah, I joined the 5-minute. Okay, so yeah, boom, this is 3 bullish candles. So let's try these candles. As you can see, 3 bullish candles. Let's say that we have the fair value gap here. So this right there is the fair value gap. 1, 2, 3, from the first candle to third candle, they don't touch, connect, or overlap. Bullish, bullish fair value gap because the second candle is bullish. And then boom, we get a bearish candle. It closes below the bullish fair value gap. So I've entered into a short position here, I've entered into a short position here. My stop loss is only if I get a candle close back above this bullish fair value gap. I don't care about wicks. I only stop out of the trade if I get a bullish candle close above my stop loss, above the fair value gap that I entered into. Of course, in my opinion, you should have a maximum stop loss just so you don't get wicked out but I will not actually use a limit order. I will market exit out of trades. Now, you should use a limit order, especially if you're newer to trading, because you don't want a big candle like this to stop you out of the market, okay? So that is very, very important. And manage the trade, okay? There's different ways that you can manage a trade. You can trail your stop loss. I could literally talk about this for hours and hours and hours, but I don't want to go into the this video too much, I'm gonna give you two examples and different ways that you can manage a trade. The first being a very nice breakeven point, okay? You need to understand that when you are trading, the most important part about trading is understanding risk management. If you don't have good risk management, then you are never going to become profitable, okay? You can be a bad trader with good risk management and become profitable. If you are a good trader with bad risk management, you will never become profitable. It is as simple as that. One way to manage your risk very, very well is a nice breakeven point in the market. So let's say that you entered into a trade, the markets look something like— that's a bit choppy. Let's say the markets look something like this, and boom, we get a fair value gap there. Your bias is bullish, we have an SMT here, we get a bullish candle close above this bearish fair value gap. This could be a breakeven point. Now, as soon as we take that high, your stop loss goes to break even, but you don't take profits. You take profits at that high. And what this will do is just block a lot of unnecessary losses, because a lot of the time price action wants to go to a liquidity point to then reverse. So if you have your break even point at that liquidity point but it's not good enough for your take profit point, then you are going to make a lot of money that way. And then another way that you can trade your— manage your trade like a professional is, um, actually by trailing your take profit or trailing your stop loss. So let's say that you enter into a trade. Let's say that's so choppy. Let's say that if you enter into the trade, it looks something like this. You get a nice entry right here, and we have a very, very big wick and a very strong draw on liquidity up here. Let's say that's a news low, and it's so far away you've got an amazing risk-reward play. And boom, we take this take profit point. But you want to target this high right here. So in my opinion, what you should do, as soon as price action goes to this point in the market, you simply move your take profit point up to this line right here. Because then, worst case scenario, you get taken out profits for one of your take profit points. So it's a win-win situation. Or best case scenario, price comes all the way up and hits your main take profit. This is a bit more of an advanced technique, so don't let this confuse you. If you know what I'm talking about here, then very well. And as always, this is a longer video, so if you made it all the way to the end of this video, leave a comment below. I gave away some funded accounts last video. I'll give away one funded account this video. Just comment below if you watch the video to the end and put a thumbs up so I know you watched it all the way to the end. And let me know in the comments below what what you want me to make a video on next, because I want to post at least 5 times a day on this YouTube, on this YouTube channel. Please subscribe, we're nearly at 1,000 subscribers. Thanks everybody for the support on this channel. I read 100% of your messages, and I will see you all tomorrow for the next video. All the links are in my bio as well if you want to join my live streams. I live stream daily
More from Louis
I lost 4,000$ Today Trading and would do it again next week... (FULL TRADE BREAKDOWN)
Losing 4,354 and i would do it again tomorrow... (80% win rate model trade breakdown)