Pete Ericson and Wally walk through a dashboard that combines Mailchimp data with other platforms to track email performance. You can see open rates, click rates, and which campaigns drive website subscriptions using UTM tags, plus spot deliverability problems and traffic trends.
So in this dashboard we're jumping into mailchimp as far as getting some actionable data out of what's happening with mailchimp campaigns. You want to talk about this one, Wally?
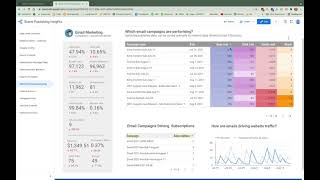
Yeah, this is one of my favorite dashboard pieces and I think this is really the power behind the dashboard. It's coming through here where we're able to pull in data from multiple platforms into one space. So you're not jumping over to mailchimp to check your data or you know, looking at Facebook, which we'll get to. It's really all on one dashboard, which is great. So one of the most popular pages for my clients again and open rate is, you know, on the left hand column we have our high level stats which are open rate, click rate, email sent and then emails delivered. The delivery stat is interesting. We don't use it a lot, but if we start to have deliverability problems, it will show up here. So that's why we. It's a stat that some folks don't look at very often because deliverability, if, if you're using an opted in list is going to be fine, but if there ever is a problem, it'll show up on that, that stat. So it's good to have. Cool. We're able to pull in the list size and then the unsubscribes from the current period. So again, another good thing to look at.
Yeah, the open rates are really interesting and the click rates are equally interesting to see what's sending.
Yeah. The other neat thing you can do with the charts that you're on there, Pete, is if you click on Click Rate, it will resort this chart based on Click Rate. You can sort columns. If you want to look at something a certain way or there's a certain way that you look at things, you can sort it on that and look at the data in that way. Gotcha. It's a great. And again, export it, pull it in. Right, right. Yep. Love that. The other neat thing that I think is, is important to talk about with this is having campaign names that are pulled through analytics so that we can look at subscription data. So just below, right here looks at which campaigns are driving subscriptions. And these campaign names are built with UTM codes and put into your emails and we'll actually pull in subscription data based on the customer activity on the site following the email. That's great. A great piece that when leveraged correctly is a invaluable piece of data.
Yeah, this would definitely be one to export and take a look at.
Yeah, yeah. And then again, we have our, I, I love trend lines and just being able to see them. So we have our power emails, driving website traffic trend line, which, you know, again, for me it's just usually a quick glance piece. It's not a, an actionable piece until it becomes a problem, but it's something to just keep your pulse on to make sure it's going the right direction.
Yeah, that's cool. Kind of looks like a pulse line.
Yeah, but super powerful page, lots of actionable data here and being able to look at everything from multiple channels really becomes the power of these insights dashboards.