This content was created by Pete Ericson. This content was uploaded by Pete Ericson. This is a YouTube video titled "Leaky Paywall Insights - Search Console" containing a conversation recorded on September 10, 2021, featuring Pete Ericson and another speaker discussing the Google Search Console, focusing on keywords, search impressions, and data exportation for SEO analysis.
So this next module is the Google Search Console. Let's talk about this.
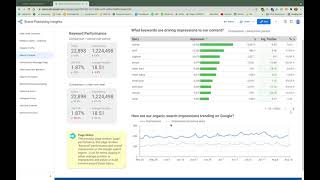
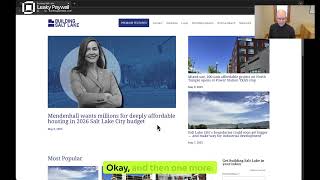
So this one really talks about the keywords that are driving your traffic and the impressions that they're receiving, whereas the previous page talked about the landing pages. So here, now we're diving into Google to kind of understand what we're showing up for, what people are searching for, and how our overall search impression traffic is trending. And it can be very powerful. So, you know, that number one item there is a very strong piece for this client. However, it's down a decent amount. You know, it could be that we need to look at that keyword and make sure that we have the presence that we need to have. The other thing I like to look at is the average position. So here you can pick out some keywords that are, you know, just above or below the threshold of the first page. Try to work on them. So, you know, if you can figure out ways to strengthen that keyword and get up on the first, first page, we're gonna see impressions jump up quite a bit as well as click through and then subscriptions and everything will, will be on the rise. So.
And that'll be, that'll be very important for long form articles.
Yeah.
So articles that are, you know, just that important to a publisher.
Yeah. The other thing I'd like to note here is just above this chart on the right, you'll see three little dots. Oh, yeah. What you can do with any of these charts is you can export them. So if you wanted to export this down into an Excel sheet and really manipulate it, there's over 20,000 records on this sheet. Right. There's a lot of data hidden in there that you can grab. And all of the charts that you find in our reports are exportable or you can sort it on the bottom right of that chart. Exactly. You can go to other pages and just keep clicking through.
Right.
But there's a wealth of data here and you can grab it and make presentations or whatever you need to do from the data.
Yep, this is great. Okay, what's the chart on the bottom four?
I like that one. It's basically looking at our organic search impressions with a comparison to the previous year. We can see that in 2021, during this time period, our search impressions are up quite a bit versus 2020. And that's what we want to see for a client that is growing and really working to add to their content and, and build their customer base.
So that's a pretty big jump right there. I like that.
Yeah, yeah, it's it's fun when it goes that way, but it can be a great chart to look at. If, you know, we. Google is constantly making updates to their algorithm with this chart. You know, if. If you see the dreaded cliff that you've just fallen off.
Right.
It's going to show up right here. So if there's an algorithm update and then we fall off a cliff, we know that either, you know, our clients, we never have that problem because we're going white hat all the way with our search engine optimization. But if there was something that they were doing, you know, that you would see a fall from a cliff, this is where you would notice it first. Yeah.
You need to get all your data as quickly as possible.