A short video walkthrough by Pete Ericson explaining the “subscription message” (aka “subscription nag”) report in Leaky Paywall. The speaker describes metrics publishers use—conversion rate of subscription prompts, traffic-source breakdowns, and article-level triggers—and suggests experimenting (e.g., reducing free-article allowance) and exporting data to optimize subscriptions.
Chapters
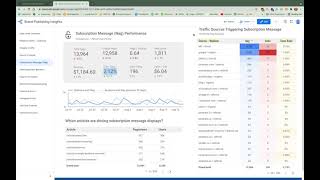
Okay, I'm loading up the subscription message, or as we like to call it, the subscription nag, which is the message that shows up when someone's run out of free articles and there's some sort of a message that prompts them to register for free or pay for a subscription. So let's talk about this page. Yeah, I think this is one of our most popular pages for publishers because it really talks about, you know, how folks are hitting the paywall and what the paywall is doing for the business in terms of revenue, in terms of how they got there and which articles are displaying the messages. So, great page. Yeah, this is great. You know, I gravitate right towards the conversion rate. Right. You have a certain amount of messages that, you know, stop the reader and says, hey, you have to register. And then, you know, what percentage of those readers actually go through the registration. So you get a conversion rate. And so one of the things that we know that our publishers are doing is they're changing their settings with leaky paywall, you know, the meter as well as perhaps the amount of free articles that they're giving away. And then this will be really easy. I think you could do it every 30 days. You could tighten the paywall by offering one less, you know, free article and then compare, you know. Okay, well, what happened to the conversion rate? Did it go up? Did it work? Did it go down? Did it not work? And you can start making some decisions just based on that one piece of data. Yeah, I think that's a great point. I think being able to make changes and then watch that conversion rate to see what happens is great. And what's interesting here on the right hand side is you have this chart here of traffic sources and how the traffic sources are triggering subscription messages. Correct. That seems to tie into, into the other set of data as far as the source of your traffic and how many subscriptions you get as well. So you can compare those two data points and really, really figure out what source is working for you. Yeah, yeah. So for this client, email is a, is a big part of their put. So, you know, sending two emails a week with content is driving subs, which is great. You know, Google Organic is, is great as well, but the email part of it is neat to see. Yeah, that's fantastic. All right. Anything else we should cover on this? No, I think the other piece is just the articles driving subscription messages on the bottom left there. And again, this is exportable. So you could grab this whole sheet and pull it down. Yeah, that's a good point. It's a good look at what pieces of content are people really hitting the nag with, which is great.