Polly Barnfield walks through building a social media performance report in Maybe, covering date ranges, growth history, reach, engagement graphs for organic vs paid content, sentiment analysis, and a "Who's Got Influence" visualization to identify your most impactful posts across Facebook, Instagram, and Twitter.
Chapters
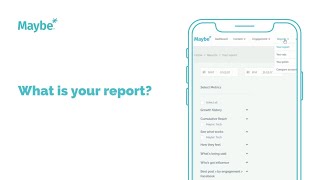
Foreign. Have you ever wondered how you can create a rocking social media report in seconds without having to pull multiple different data points from different social media sites? Going to show you how to do just that. So let's head to the reports menu from across the top and choose your report. I'm going to walk you through how to create a brand new report. So from this dropdown on the right, let's click Create New and I am going to create a report for the entire month of March. Now your report will show you your social media performance over any given period of time. You can look at it from a week or you can go three months perhaps. And all your social media metrics are about to be visually represented in graphs and charts. So the first one I'm looking at is my growth history. So how has my social media audience grown or decreased over a period of time? I'm going to look at my reach. So the amount of people who have seen both my organic content and content that has been boosted with paid support for that same period of time, I'm going to add the See what works graph. So you will get two reports for See what works. So the first one you will see is see what works for your business. This will show you the amount of posts you've created. The purple is your organic content, the teal color is your paid and you can choose to switch off any of them. Switch them back on. So you will see the solid color the posts and the more translucent color overlaid across the top is your engagement. And the second engagement graph you will see is what is working in the conversation about you. So this is conversations that have been created by other people on social media and the engagement with those. So we can see here that there were 56 posts created about us generating 329 engagements. And at any point you can click on any of these graphs to see what posts were driving those spikes in engagement. The next one we're going to look at is how they feel. This is a sentiment graph. It's going to show us literally how positively or negatively do people feel about us. So you can see it for your mentions, which is what other people are posting about you. But you can also change the view to see how positive or negative the comments on your own content have been. Again, you can click anywhere on this graph once it's finished crunching the data to see what those posts were that were positive or negative. And it will just open with a little overlay here and you can then also choose to go back and engage if you want to, but for the purposes of creating a report, we're not going to engage with that right now. Next up, I want to see what's being said. So again you'll get two graphs for this one, you, you will see first and foremost what's being said about you, split out by comments and mentions. Again, so this is people commenting on your posts, or in the mentions case, people creating content about you. And you can also take a look at the words you're most frequently using in your posts as well. And this is a really useful way of checking on a minute is what I'm saying, in line with what I want to be saying. So if you know you're doing a big marketing campaign around social media tips, you can look at this and say, great, I am seeing that I am frequently talking about social media tips, but maybe if you were wanted to see social media management being used in your campaign, it's not there in your social content yet. You know, you need to increase the amount of posts you have with that phrase in. So a great way of checking is what I'm saying in line with what I want to be saying. Then we've got the who's Got Influence report. So this again will show us the mentions. So these are the people creating their own social media posts about us. And if you switch to comments, you've guessed it, you will see the social media accounts that are most frequently commenting on your post. The bigger the bubble, the more frequently that user is active. Next, I'm going to choose to see my best social media posts. We've got that for Facebook, Instagram and Twitter and this is the best social media posts on by the amount of engagements. But for Facebook and Instagram you can actually look at that by reach as well. If you choose these filters here. I'm not going to do that today. I'm just going to show you the best posts by engagement and for each channel you will see your own best post and the best post that's been created about you. So here we can see that we've got a live video that was the best that we created and Earwashborough Council was the best post created about us. And again, you've got that for Instagram and for Twitter as well. So I've walked you through this, it's taken me six minutes. But once you know what you're doing, I promise you, you can create this report in about 30 seconds. And to make it even easier for you, if you don't want to be creating this report every month, you can add some notes to it. You can add notes under any one of those graphs as well. And we'll just say this is our, sorry, our March highlight, Adding the notes. And then once you've done it, you can choose to save that report, give it a name. I'm going to call this one March Save. And now if you want to run the same report for another month, you can choose to clone it. By hitting that button there. And you will be able to rename your report and simply swap out the date range here. So maybe we want to do it for April. Need to change the end date first. Let's do this one and then do April. And if we just let it do its thing there, you can see you haven't even got to go through and add all the graphs again. They will all be there for you. So whatever social media metric you want to report on, build the report by creating new. Once you've built it once, you can just clone it, rename it and swap out the date range. And if any point you want to go back and look at an old report, they will all be saved in your drop down for you just here. So I hope that's been useful. I hope I've saved you hours of time creating social media reports. If you've got any questions at any time, you can use that blue chat button down there in the right hand corner. It will connect you to any member of the Navy team who can't wait to help you. And I hope to see you on another video soon.