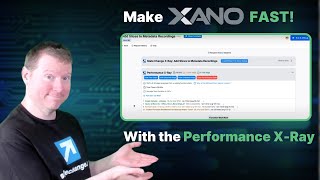
Ray Deck shows how to use the StateChange extension's Performance X-Ray to find what's slowing down your Xano app. It ranks tasks and API endpoints by total utilization (execution count times duration), so you can see that a function running 1,000 times for 5ms each matters more than a single slow step.
Chapters
One of the most common questions we get about Xano is how to get more performance out of it. Uh, and that is why the StateChange extension for Xano, uh, gives you not only the ability to see what the sources of errors are, you know, just like we had previously, we talked about it in the workspace, uh, the X-ray in the workspace. We also have a performance X-ray. And so if I were to either scroll past this or just close it up, um, I can see the performance X-ray that's right underneath. And this is available for people who are signed in to their StateChange, you know, using the extension, right? So this is going to be for our paid product. Uh, and in here I can click on build a new history report and I can look at the history report over the last 6, uh, 12, 24, or even just 1 hour and just sort of get a sense of what performance has been like. This does not go over a longer period. That is a different question of observability. This is a question of just being able to dive into troubleshoot to figure out where the major issues are. And by running this, I can see, all right, very quickly get an overview of which processes across tasks. Across API endpoints, and also across triggers that have been running, how often they've been running in the course of the last whatever the period is, like this update videos runs every 15 minutes. So it runs, has run 4 times, and how long they take on an individual item basis. And also we'll separate out those things that are coming back successfully, like 200 responses versus those that are error responses. So you can tell like whether you're failing fast, succeeding slow, the reverse, or sort of whatever is going on in here. And it sorts it based on the total utilization, because the way PHP works under the covers, it sort of provides a little bit of a lock on your CPU while it is working on your process. And so a way of getting a measure of how much resource your overall system is taking is to take the product, right, of the number of times something is run and how long it takes for it to run. And this gives you a total runtime, which is based on the actual calculation from the history that otherwise you would, you know, go hither, thither, and yon to put together in your Xano logging. So, so based on this overview, I can identify, okay, what's really taking up resource, because you can spend a lot of time optimizing something, but if it doesn't run all that often, or if it's pretty fast, you don't need to optimize it. It's not going to be what's slowing you down. But here I can see the update videos is driving most of the bus, which is appropriate. It's, you know, it's a video processor, it's going to take up some more resource. We can go click into it, understand it more deeply, what's causing the issue. And inside here I can see that, well, this is a task, it's made up of running a few different functions, and I can do a run and debug on it. Although it is pretty, um, a slow process, I probably wouldn't do that right now. I can probably get better use out of clicking Load a History Item and just picking one of the recent history items. This, by the way, is the same thing as, you know, clicking the history just like you have in your Xano to go find a recent item and say, okay, well, let's sort of see. This one took 103 seconds. What may take 103 seconds? And in here I can look at what actually took a while. Now, right now it's only showing me my slow steps and it's not showing me my fast steps. So if I want to get a more complete view, I can just click Show Slow steps as well. I'll be able to see these things that, hey, where these went pretty fast. I can also take a look at any disabled steps might be in here as well as the, you know, untested steps that can be pretty handy to have in there as well. In fact, I like to have sort of the more complete view because that's sort of the way I roll from an informational point of view. And also I can then, you know, scroll on down to figure out which of these things are taking longer and sort of have that in context as to the why. I can then do additional run and debugs, and every time you do a run and debug, it automatically updates this. Every time you do anything else, it automatically updates this. And I'll do you one better, which is that because it has identified this function takes a little while, if I were to go click into this function, it will show me how long it took in that last run from the task. This allows me to drill down, figure out what things are really causing either challenges or performance or whatever, and therefore where I should be focusing my attention. Now, just because it's slow doesn't mean that it's wrong. I mean, there are lots of things we do that are relatively heavyweight, but by looking at these, you can be getting a better sense both of how long they run and and how often they run. For example, you can see that in this, it ran this Create Variable just the once and this Create All Records just the once, but it ran this custom function in here 25 times. Now, each time it ran was only 1.57 seconds, but that meant overall it took about 40 seconds. So this gives a sense of what the impact is on a total basis, just like it did for going across the workspace. This subsystem here is super helpful for figuring out like where things are slow and a little bit more why and being able to get into the individual function steps, individual subsystems, drilling down, down, down to find out where your, you know, where performance really comes from and where those challenges are. It is, I think, one of the more useful parts of the paid system. We'll be talking about some other features soon. But I think that if you are trying to figure out where your Xano system is slowing down, I totally recommend that you get this because this is something that will let you and your Xano go faster.