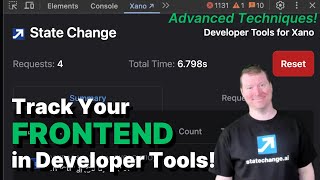
Ray Deck shows how the Xano State Change browser extension now tracks frontend-backend interactions in Chrome Developer Tools. The extension lists API calls in a Requests tab and summarizes them by function, showing counts and performance data. Click any summary entry to jump directly to the Xano function for debugging.
Chapters
All right, the state change extension just got better. Uh, previously we're really focused on, you know, helping you work inside your Xano, uh, through adding power tools that would, you know, augment the user experience in there. We've got more of that too, but I want to draw your attention to something a little bit different, which is how you can use a state change extension to help you with your front end as well, to understand how it's relating to your Xano. So instead of having to go to your Xano, like, look at your request history You actually have access now in what are called developer tools. Now, in Chrome, there are a few ways to be getting to your developer tools. You can right-click, you can say inspect, you can use Option+Command+I or Control+Alt+I in Windows, or you can pick from more tools here and pull up your developer tools. And these developer tools are always really handy, and I'll always tell people to go check them out, especially if you're developing more deeply trying to understand the relationship between your frontend and your backend. If you haven't used it before, this allows you to see what the HTML looks like. This allows you to see the various things that are coming through your console. And this allows you to see, you know, raw network transactions that are coming through. But I want to bring your attention to an additional one, which if you have an interface like mine, you probably might see a little bit of chevrons like this. And you'll see some additional stuff over here, like Lighthouse, privacy, security, these are things all worth checking out. But if you've installed the state change extension for Xano, you will now see something down here called Xano with a little state change icon next to to it. When you click on that, it will bring up the developer tools that will let you see the relationship between your front end and the back end. Now I can just do a little quick reload here, and it will track the various API requests that I've been doing between my front end and my back end. Now I can see all those requests lined out here underneath requests, but usually what I look at here is a summary, and the summary allows me to understand how many requests went to each of my functions or each of my API endpoints in my Xano, like which number they go with, what their name is, which API group they go with. And not only that, I can click through it and, you know, understand both how much is being used, and I can go open up a Xano and have direct access to it to understand more of the whys of why this thing might have been taking quite as long as it was. So the idea here is that you can get access to this more quickly, you can be seeing what's going on. And then of course, as I navigate around, I just have them go take a look at my, you know, tags and like, I will look at things related to AI-assisted development. You'll see how these things start ticking up, right? They are capturing more items in here that are, that are just kind of, kind of useful, you know. So I hope you'll check it out. That helps you sort out what is driving performance and what makes things go faster or slower in the overall time that your your system is going back and forth with your Xano. And, and let me know, let me know in the comments how it can be more helpful to you. I'll see you soon.