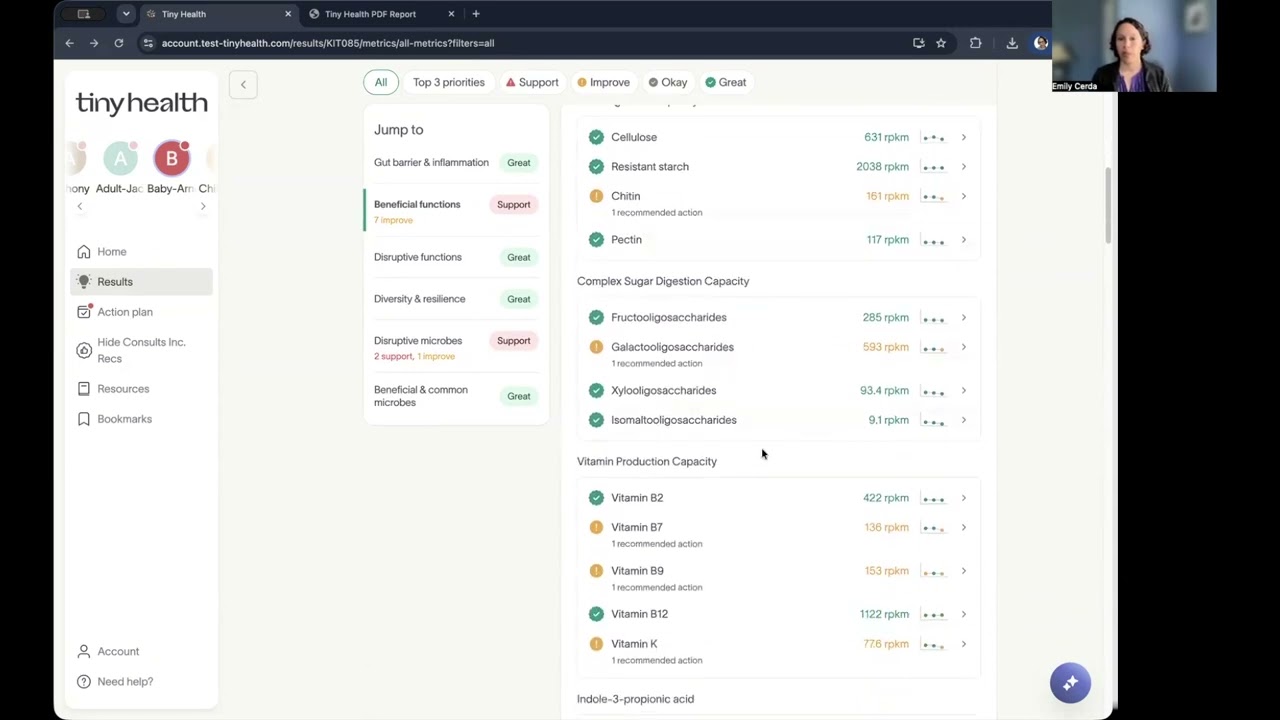
In this instructional video, microbiome specialist Emily Cerda walks clinicians through the Tiny Health interactive results portal. She begins with the main results page, explaining the microbiome summary score (a weighted algorithm that aggregates shotgun metrics and compares the patient to age‑matched peers), the microbiome age and resilience scores, and the kit ID and test date information. She describes how to download a static PDF for EHR integration. The metrics are organized into categories (e.g., gut barrier, inflammation) with a prioritization panel that highlights the top three actionable areas such as mucus degradation, hydrogen sulfide, and disruptive microbes. She explains the non‑diagnostic condition associations that link observed microbial patterns to research‑based health topics (e.g., constipation, food allergies). The left‑hand navigation bar is detailed, covering Home, Results, Health Responses (patient survey data), Action Plan (recommendations), Resources, Bookmarks, and Account settings. The Account section allows patients to add a practitioner, which grants HIPAA‑cleared access to the clinician’s view of the results. Finally, she demonstrates the patient note feature: auto‑saving, hyperlinking, and a Publish button that sends a notification to the patient. The video serves as a high‑level orientation, with references to deeper‑dive videos for each section.
Chapters
Hi, my name is Emily Cerda. I'm a microbiome specialist here with Tiny Health, and today I'm going to talk to you about your results page navigation so that you can feel good about interacting with these interactive results and you can navigate around. We do have other videos, video walkthroughs looking specifically at sections of the test metrics. the action plan bookmarking, all of that. So please check those out. And here I'm just gonna give you some basic navigation at this results page. So when you load into your, your patient results in the portal or interactive view, what you're gonna see is this page. This brings you to the basic overview. So your microbiome summary score, looking at the shotgun metrics and how that microbiome really compares to others the same age for this individual. You can see this is a population curve here, and they are falling a bit below the median with a 74. That number takes all of the metrics into account and really kind of— it's an algorithm that will give some points for some metrics, take some away for others, and it's weighted based on the importance of that metric in the development of the microbiome we would expect at the age of the patient. So that is the first thing that you will see here. You'll also be able to see microbiome age and resilience score and the microbiome breakdown, which I will go into in other videos. You'll, you'll see at the top the test when it was taken, and if that individual has taken other tests, you can click the dropdown and you'll be able to see the other tests that they have taken. You'll see the kit ID, which is important in sharing with the clinical team or with your account manager if you have any questions about either the ordering or, or anything related to this test, whether it's clinical information about what you're seeing in the test and the results, or if it's anything logistically that an account manager can help you with. You'll see the age of the individual, the version of the test, and then you'll have the ability to download the PDF, which is just static document that brings all of this information as well. That is great for putting in your EHR if you need to. So this is really the main page here. As I scroll down, you will see the metrics. They are divided by category. So we have them in these different categories because you can see gut barrier and inflammation. And then there's a prioritization there. They do need some support, we can see. And the prioritization looks to be mucus degradation index, hydrogen sulfide index. There's also disruptive microbes. They need support in a number of places and then places to improve. And so those top 3 things that we see influencing these results will be called out in the what to prioritize. So you can see some butyrate production here, and then these inflammation markers are being called out for prioritization. You can click into this and it will bring you into the O-Metrics and you'll see everything in much more detail and get more information That way, but here on the main page, this is what you'll see. Down below this, you'll also have the ability to look at associations. So these condition associations—they are not diagnostic, but what they are is looking at the microbiome pattern in your patient and seeing does the patterns that we see—are they replicated anywhere in internal or external research? In saying these are microbes that are that. can be associated with constipation, for example, or food allergies. And so if your patient has some metrics that line up with that, we just call these associations. It certainly doesn't mean that they're at higher risk or that this may be occurring. But sometimes you will have somebody who complains of constipation and you will see, oh, there are some things we could influence. Maybe the microbiome has a little bit less effect on that. But of course, we know the body is complex. So this is, this is one piece of the puzzle, but it is fun to see because the microbiome has so much influence across all of the organ systems. So we are pulling that data here, and you can look at that there. So other things to note on this page, on the left-hand side, you will see kind of a navigation bar. If right now we're on the results, If I click to go to home, this brings up this individual, both of the tests that she's run. The see results is where we just were, and you also have the ability to click health responses. If you click in here, you'll be able to see the survey data that the patient filled out for this test. So we do ask, you know, what are your current complaints? Why did you run this test? What does your diet look like? Because those are all important for us in interpreting the results. And so you'll— you as a practitioner will be able to click into that. You'll be able to see what was really shared with our team. You will also be able to navigate on this side to the patient's action plan. And I'm not going to go into this, but you— we will go into this in a different video. But that is where we pull all of the recommendations together based on those top 3 things we saw and more. Resources are here. Bookmarks are here, which I will get into when I talk about the action plan in the other video. You'll also see account. So if you click into account, this is where you can tell your patient to go log into their their patient view, click account, and this is where they can choose to add you as a practitioner. So if they click edit here, a list comes up. You can type your name right in here, and if as long as you're a practitioner registered with us, your name will pop up. And once they hit save, that really tells us that you are their practitioner, and it also can pull their results into your account. If you've ordered their test for them through your account, it automatically will be linked. But still, we often like, especially if you have somebody who already ran a tiny health test. Make sure they put you as a practitioner here, because then our clinical team knows if they've said that you're their practitioner, we have HIPAA clearance to talk through their results with you. Otherwise, if it's not there, we do have to get that permission from the patient first. So the only other thing to note here on this main page is up in the far right, you will note that there is a patient note. So you have the ability to click into that and to navigate the metrics. So you can navigate away from this page, and this page will hover into all the metrics, look around, and you can type in here and leave, leave a note for your patient about we're gonna do XYZ. You can also hyperlink. So if you would like to put in a link to supplements that they can buy through you, or a link to any other resources, you can do that in this note. You'll note that when I type, this auto-saves, so you do not have to save in any way. It's going to automatically save that for you. If I get out of there, if I go do something else and I come back to it, it will still be there. But the publish button really takes what has been auto-saved and pushes it to your patient. So I don't recommend hitting publish until you are ready for that patient to get a notification that there's a note in there. portal for them from you. But yes, that is, that is the patient note, and that will also show up in your practitioner portal. Okay, I hope this is helpful, and I will see you in other videos if you want some help navigating the action plan or looking through the metrics themselves. Thank you.