Updated metric categories, PDF redesign, and more!
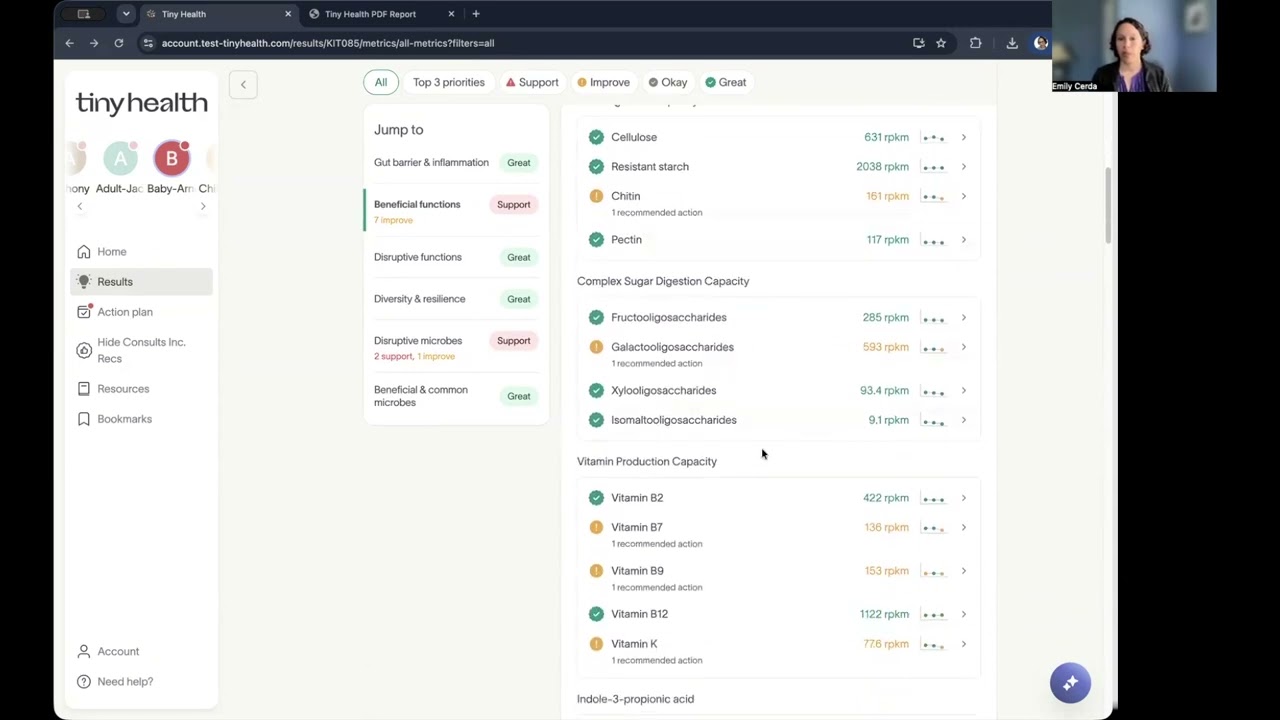
Emily from Tiny Health walks through portal and PDF redesigns for microbiome reports. Metrics now split into Beneficial and Disruptive Functions with status tags and priority numbers. The new PDF includes a microbiome summary score, gut-type placement, and a Recommended Actions section with food lists and supplement suggestions.
Chapters
Hi everyone, my name is Emily. I'm a microbiome specialist here with Tiny Health, and we have a couple new, um, product updates to announce to you, um, that we want to get out so that, um, things don't look confusing in your portal or on the PDF. So the first thing I'm going to show you is, um, the portal and the new changes, and then we're going to talk about how this is also going to look like a refresh to the PDF experience. So if you only use the PDF, stay tuned just a minute. Um, so here we have the main page, the main results page for this individual. You will see if I scroll down, we have listed here, um, your metrics by category, and you will see the what to prioritize. So you'll see 3 things are still being shown right here, but we're just not— we no longer have those 3 main findings. So you still have the information, it's just presented a little bit differently. You'll also notice that we have different category names for our metrics. All of the same metrics are still in the test. They have moved around a little bit based on the function of the microbiome. So, for example, you will see beneficial functions and disruptive functions to kind of separate some of the metrics in our test based on what, what they do in the microbiome. So, um, within In these, you will also see at a high level here before even clicking in the categories, and then you'll see a support, needs support, needs improvement, or great tags, or support, improve, and great are the new tags. And that's still green, yellow, and red like they were prior. Support is if we have one red flag or if there's four or more yellow flags within one category, then we'll we'll make it red and say it needs support. The improve is going to be if there's 1 to 3 of those yellow flags where we need some improvement. And then great, there are only gray and green metric findings within each of these categories. So from here, you can still go into See All Metrics like you could before, or one of the big changes that we've made is that if you click into one of these, categories, we wanna see the beneficial functions, for example, this will load into the all metrics page and it will automatically scroll to the section that you're looking at. So we're no longer at the top of the page where you have this long scroll experience. We're gonna scroll you right to where you want. Likewise, this is gonna work if you scroll down. We can click on this left and we can look at those disruptive microbes. Um, you'll also see that priority numbers are called out. So remember, we're still talking about those top 3 main findings. We're just not calling it out in a separate box on that main results page. They are still called out on the report here. Um, you will also note— I'm going to go back up to beneficial functions here. Um, you will also know if your user has tested many times, um, that you will see a trend line. Next to the metric. So you can still click in to these metrics like you could before. You'll still be able to see this over time, but at a high level, even at this All Metrics page, you will be able to see the trend and what is going on currently in this test. So this really— we're really trying to help out here to help your user experience. A lot of testing went into that.— we do still have at the top the ability to filter. So you can filter to those top 3 priorities, which will show up as we go down. You'll notice that the thing that it is filtered by will be green. So for example, if I wanted to only look at the OK metrics, it's green highlighted. So we can still we can still toggle like this. So I hope this is very helpful. I look forward to helping you guys go through this. We have seen, or we have changed some of the metrics as well, as far as their placement within these categories. So just to give you a high overview, I'm going to scroll through. You'll see Gut Barrier and Inflammation. We still have those inflammation metrics, Host DNA, In the beneficial functions here, we are looking— now this is a 2-year-old, I believe. So we are looking here at bifido and HMO-digesting species for those beneficial functions. HMO digestion capacity here, short-chain fatty acid production. Um, a lot of these, uh, we've talked about, they were in that digestive capacity 4. Um, we also have the indole-3, which is in our protein breakdown metrics, and now we've pulled that out because it is a beneficial function, um, as well as GABA production and oxalate degradation. To contrast that, some of the disruptive functions that were all lumped together prior are these protein breakdown capacity metrics, with the exception of the I3PA, our histamine index, um, the methane production metrics. GABA breakdown would be detrimental. We still have our diversity and resilience metrics here. And then, um, disruptives really haven't changed. You'll recognize that section. And then the beneficial and common microbes, and you'll see this is where we're looking at things at the phyla level. We are looking at those commensals. Our beneficial bacteria and our common probiotic species. Okay, so to contrast this, we have the PDF. So this, you will notice a new cover page here on the PDF. So we'll have the kit ID, when the sample was collected. On the second page, you're gonna have that information again, information about the patient, and then information about our Tiny Health tests and what is available. Third page is about our methods. So how does shotgun sequencing compare to other types of GI testing? And then we get into the test. So the microbiome summary score, this is gonna look very familiar to you. The, um, if we had a PRO test, the PRO metrics would also have that PRO evaluation there. And then we've moved the gut type to the top. So we've, we've heard that this is a very important page for many of our users. Here we've moved that gut type to the top for you. We have also started to lean into some of these associations. And so this is a work in progress, and this first iteration calls out the different condition with flagged association. So different microbial patterns within that microbiome and how they may relate to some of the conditions you see on the left. You'll also see the flagged metric. So what, what metric is called out for that particular condition? We come to this page, which has your results summary, and this is very much looks like the portal view I just showed you where we do have those different category names, and you will be able to see how many need support, need improvement, are okay, or great. Um, and then you'll see the tag next to it to mimic what we have on the portal side. You'll also get right up front those 3 main findings, right? The, the top things that we want to prioritize, um, for this individual. And before scrolling further into the test, one of the biggest changes to the PDF is that we are calling out some recommended actions. So here are just at a glance what's going on with this individual, things to focus on, and your top actions for the individual. As we go down, we start to get into these, um, different categories, and they will be laid out the same that they were in the portal. You'll be able to see a little bit about the metric, the evaluation, the details, and then that over time graph. Um, if they have tested multiple times, you'll also be able to see for gut barrier inflammation at a glance what this looks like up here for your individual. Further down, um, we get into beneficial functions. So you will see this is laid out just the same. So I'm gonna do a scroll here. When something needs improvement, you'll see that in the red, and we do call out the the percentage or the measurement nice and large for you. Okay, so I'm going to go through. We get the, we get the hint for these different measurements. As I come down into the— towards the end of the test, there's a lot of metrics in our test. You will notice a big difference is that when different things are called out for beneficial bacteria and even for some of the disruptive microbes, we are listing species. So you'll see that species list here. Um, and then further down into the disruptives, I want to get into the disruptives category. Oops. We will also call out toxin genes in this as well. So it would show up this individual's It's a 2-year-old. It's a good thing didn't have toxin genes, but if they were found, um, those toxin genes would be called out here and listed underneath the metric. So further down, um, at the end of the test, we do have recommended actions. Like I said, this is a big change for the PDF. We didn't have actions before. Um, so here you will see like why this is step 1, and this does match to the action plan, um, in the portal. What we should do about it. Our step 2 is all listed here. It's worth noting that these— the recommended product list, the supplements— you do have the ability to turn off supplements in your practitioner portal. There is a slider in your settings in your portal, and as of the release of this, which should be very, very quickly, You will also have the ability to turn off the action plan for your patients as well. So, um, here you can see more actions, and then we do have a food list, a recommended food list, and this is aggregated from the recommendations, uh, that were made in the action plan for this individual. So this is everything together, like a shopping list, if you will. Further down, we do have supplement recommendations. So products related to the SBI powder was, was recommended for this individual, and you will see that there are links to those here. Again, you can shut those off at your practitioner account level. In the appendix, the first page does have that microbiome breakdown, um, and then we are going to get the big list of everything that we have found in the microbiome. And beyond that, we have a metrics index, and this metrics index is at a glance everything that is going on for this individual's test results. And you'll see things called out here with the red, green, or gray or yellow metrics. Um, and so you can see at a glance what is going on. Towards the end, we have how to read your results, how to read this report, and it does talk a little bit about the science, like what the measurements are in the report, how to read those, how to use the actions, how things are ordered., and then a resample timeline, and our references. So I hope this is helpful. We'll be talking about this a lot in the upcoming days and weeks. Um, so definitely reach out if you have questions, practitioners@tinyhealth.com. Um, and we look forward to supporting you and, uh, learning more about how you like this and how we need to change things to make it easier for you to use Tiny Health Testing.
More from Tiny


Tiny Health Raises $33M Series B to Establish Microbiome Intelligence as the Standard of Care