Learn to build cohort tables that track customer batches by join month, converting counts to churn rates and spotting trends with conditional formatting. Overall churn hides problems in your product, marketing, onboarding, or pricing that cohort analysis reveals.
Chapters
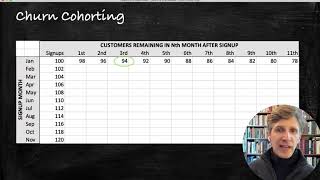
Hi. Here's a video on churn cohorting. What it is, how to do it, and why it matters. Let's say our startup has a 4% monthly churn rate in December and we want to know are we doing the right things to improve that? The problem is churn rate is a lagging indicator. It's most heavily influenced by when a customer started, not when they churned. We might have a large batch of customers from June that has a particularly poor churn rate and a smaller batch in November with a better churn rate. We're not going to know what's going on with our composite here in December. So what do we do? We look at each one of those batches of customers or cohorts separately. So just the customers that joined in January, they alone might have a 2% churn rate after their first month and a 1% churn rate after their second month. We can do the same thing for those other batches or cohorts. What does this look like in practice? Let's say we have a fictional startup that has 100 new customers join in January and, and they're growing more and more quickly. So the next month they have another 102 join, and in November they have 120 new customers join. Now, nothing is perfect. And so of the hundred that joined us in January, perhaps, say, we only have 94 still left after their third month and after the sixth month, of those hundred that joined in January, only 88 are left. We do the same thing for the other batches or cohorts of customers that joined after that. And so you end up getting a triangle shaped set of data like this. Why is it triangle shaped? For example, the customers that joined us in November last month, we don't yet know how many will be left after the second month because it hasn't happened yet. Now, we've been talking about churn rate. These are counts. We can convert these into churn rate. For example, the customers that joined us in July and after their fifth month, we lost two of the 104. And so we know that that equates to a 1.9% churn rate. That allows us to convert this whole chart from counts into churn. Now, this is a little hard to read, so you can apply the conditional formatting from your favorite spreadsheet and you can get something like this, which allows us to see, for example, that this startup does appear to be getting better over time. Now, this is a little bit of a fictional example. Let's take something that's a little bit more realistic. Here's a startup from a parallel universe that did something very wrong in July and August. Perhaps it was a marketing campaign that brought in a batch of low quality customers, or perhaps we used a very different onboarding process for customers that started in those two months. Here's another parallel universe with a startup that had a very high churn rate after three months. Perhaps it's because they have a free trial period and then after the third month customers need to purchase. So that's cohorted churn rates. They're particularly useful for diagnosing changes and tests that you're running in the different functions of your company to see if they're affecting or improving your churn rate. And they're crucial for diagnosing what happens with different pricing changes, for example Free trials and annual contracts. Enjoy and good luck.