
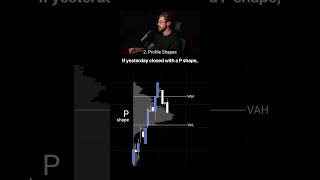
In this concise tutorial, the speaker warns that misunderstanding three key trading concepts can hinder profitability. He first explains the volume profile, highlighting its three critical levels—value area, point of control, and nodes—and how it can provide directional bias beyond simple candlestick analysis. Next, he describes profile shapes (P‑shape, B‑shape, D‑shape) and how each shape signals the likely next‑day market bias, guiding traders to go long, short, or stay out. Finally, he covers high and low volume nodes: high volume nodes indicate areas where large positions were built and price tends to stall, while low volume nodes create fair‑value gaps that price can quickly traverse when momentum is present. The speaker urges viewers to study these concepts on their charts to improve trade decisions.










