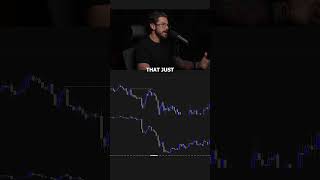
A trader shows how to spot fake liquidity sweeps using price action and the Cumulative Volume Delta indicator. When price hits a new high but CVD doesn't rise, it's passive orders pulling price up, not real buying. That mismatch signals a rejection is coming.
Chapters
Here's how to spot real liquidity sweeps using order flow. So on this chart, we have price action on the top and CVD, which stands for cumulative volume delta, on the bottom. So as you can see right here, price ended up sweeping out this high. But if you notice on the CVD, price was much higher here than the CVD was higher here. Now what CVD shows you is the amount of aggressive, or traders that are using market orders, in the market. So we can see there weren't really many aggressive buyers. However, price still rushed up to this high. That just means that it was the path of least resistance and there was no real traders behind it. And this was just acting as a magnet because some passive trader had a limit order. So once price moves to this area and we see it reject, we know that that passive seller is now in control and we can target recent lows. If you wanna learn more about combining order flow and ICT concepts, follow my page.