
How To ACTUALLY Trade Order Flow
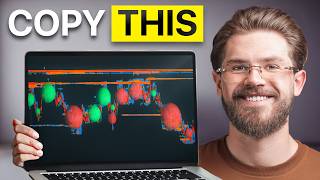
Jesse Rogers shows how to trade order flow using six core concepts: delta, absorption, and volume profile. He turned $10,000 into $180,000 with a rule-based system that enters when aggressive orders hit passive walls at key price levels, then trails stops using imbalance points.
Chapters
If you're confused by order flow, then this is for you. Order flow is powerful. That is why all professional traders use it. But here's the problem. Most people teaching it just give you a bunch of vague concepts, but no clear process. Now I've been trading for 10 years and recently took an account from under $10,000 to over $180,000 using a simple rule-based order flow strategy. And in this video, you'll learn that exact strategy step by step. So you finally have a clear checklist to trade order flow yourself. Let's hop right into it. We're here on Tradovate.com, which is a regulated futures broker, and I want to log into my account live and show you guys my performance. Now, I do this not to flex, but I do this so I can show you guys that I'm actually putting real risk and money behind the strategy I'm teaching you. So we're going to go back to whenever I started this account, which was in November of 2025, and go to my results up to today. As you can see, $180,000 in profit. And I did this starting with less than $10,000. Now, I want to be clear that these results are not typical. I've been doing this for 10 years and you're not going to have the same results as me. Now that we got that out of the way, let's get right into the video. Here's how this is going to go. We're going to break down the basics of order flow in a stupid simple way. That way you actually understand what you're looking at. Then I'm going to show you how to use the tools you'll need to trade order flow and the settings that I use. And finally, we'll go into the step-by-step process of how you're going to find trades using order flow. And it doesn't matter No matter if you're a beginner trader or if you're advanced, whether you trade futures, stocks, crypto, or forex futures, the logic remains the same. Believe it or not, order flow is simple and you really only have one goal when using it. You're trying to determine whether buyers or sellers are in control of the market. First, let's start with the basics. Now, I broke this into 6 simple steps. There are a million different concepts of order flow, but I wanted to remove all the fluff and give you guys exactly what you need in a very simple way. Number 1, which is one of the most fundamentally misunderstood concepts in trading, is that every trade is just one buyer and one seller. Now, a lot of people think that when the markets are moving up, that there are more buyers than sellers, but that is not how it works. Now, one order, meaning like, let's say if somebody puts in 50 orders, that could be multiple trades. But at the core level, every trade is one buyer and one seller. And that is what equals 1 volume. So when you're looking at volume at the bottom of your screen, that's going to be counting the number of contracts sold. Okay, so those bars on the bottom of your screen. So if you had a volume of 1,000, that means that there were 1,000 contracts traded. And for each one of these, there was 1 buyer and 1 seller. Now, the second thing you need to understand about order flow is the bid, the ask, and the order book. So what you're looking at right here is a visualization of an order book. And simply put, This just shows you the amount of contracts that are ready to be traded at a specific price level. If it's above the current price, then that makes it an ask. What this means is that there are 600 trades passively waiting to be filled if price goes to this number. So we call these passive sells. Okay, we'll get back to what passive and aggressive means in a little bit, but for now, remember that anything above price is an ask. And then anything below price is a bid. And these are passive buys. This would mean that at 23,505, there are 250 contracts ready to be bought, but they're not going to buy above this area. Now, the distance between these two, which is the best ask and the best bid, is what we call the spread. Now, in typical markets, the spread is going to be less than 5 points. But for the sake of explanation, I just wanted to teach it to you this way. And wherever you see a lot of contracts for sale, that's going to be a difficult area for price to make it through. Now, another word for this is the depth of market, otherwise known as the DOM. And this is where you're able to see those passive orders. So out of all these asks, we would say that these sellers are the most passive and these are the most urgent, right? They're willing to sell for a lower price than these guys because they want a higher price. So they're willing to wait in line. They've got 1,000 contracts. In between them and getting filled. Next, let's talk about aggressive versus passive orders. Okay. Most of the time when you're executing in the market, you're probably like me using a market order. Most retail traders use market orders because we want to get filled immediately. So when we hit buy, we send a trade into the market and there are passive sellers that are waiting to fill our order. Now, the amount of passive sellers is a term that you've probably heard a lot, and we're going to get over how to actually use this. But this is liquidity. This is a word that gets thrown around in trading a lot, and most often it is not explained correctly. So when we talk about aggressive versus passive, an aggressive buy is a market order that is lifting the ask. Okay, so if you're aggressively buying, that means you are taking what somebody is asking for price. So in this example, let's say price is sitting right here and you put in a market buy. You're going to get filled at the best ask, which is the lowest willing seller. And this is the price that you're going to get filled at. Now, a lot of you guys have heard of slippage. Let's just say if there weren't any contracts for sale for a wide range, then that's where you incur slippage. This happens a lot during high-impact news, and it's why your stop loss, if you are in a trade at these times, can actually cause you to lose more than you had planned because a lot of traders pull their orders off of the books and these books get really thin and you won't have this high amount of liquidity to trade. And vice versa, if you are putting in a market sell, then that would mean you are aggressively selling and you're willing to hit the bid. So remember, aggressive selling is a market order hitting the bid, and aggressive buying is a market order lifting the ask. Now, a lot of people get confused in this because the ask is passive sellers. But remember, an aggressive buyer is going to put in their trade and it gets filled to a passive seller and vice versa. So trades happen when aggressive hits passive. And this brings us to the fourth concept you need to understand, which is delta. Now, this is the most misunderstood concept. And when most people start trading order flow, they think, oh, we have a high delta, which just means more market buyers. So they think the price is going to go up, but that's not at all how it works. In fact, that's actually a lot of times the opposite. Let me explain. So simply put, aggressive buy volume, meaning the number of market orders, okay, the number of market buys minus the number of market sells equals delta. So let's just say if you had 200 aggressive buyers and then there were only 100 aggressive sellers in a candle, then that would mean delta was 100. It would be green because we have a positive 100 delta. But a key concept to understand is that delta just shows you who was more aggressive. Not necessarily who won. Now, this is measured per candle, per price level, or per session. And we're going to go over some tools in a second that you can use to measure this. But the key takeaway I want you to have is that when you have high delta and price doesn't move, meaning there's a lot of aggressive buyers but price isn't going up, well, that means that something else is going on. And this brings us to concept number 5, which is absorption. Okay, so let's just say you have a passive sell wall. Remember that order book? Let's just say there are 1,000 contracts for sale at a given price level, and let's say the market is hitting into it and you see Delta is really positive. There's a lot of buyers hitting into this level, but price isn't really breaking through it. Now, a lot of traders think that since we have that positive Delta that the market's going to go up because they say, oh well, the markets work by there being more buyers than sellers. If there's more buyers than sellers, then the market's going to go up. That is not how it works. And in fact, the way that you use order flow is oftentimes going to be fading that idea, because if the market has a lot of aggressive buys piling in but the passive sell wall is stronger, what this is going to show you is absorption, because those aggressive orders are getting absorbed and it's causing price to stall. So that means that there is some large passive player that is in control at that level. Remember, order flow is all about knowing who is truly in control of the market. So Delta can show you that buyers tried, but then they got exhausted and passive sellers absorbed them. Okay, very important concept to understand. And I'm going to show you a very easy way to spot this. But the key thing you have to understand is that you must watch at specific levels. Okay, if you're just watching for absorption all the time, you're going to get burnt. You need to watch for this at the right levels, which brings us into the sixth concept you need to understand about order flow, and that is the volume profile. And this is my favorite way to find levels. So let's just say you had an example where price had been moving and you have a lot of different market structure in this range, and the market is kind of all over the place. Well, you can see by using the volume profile where the true volume happened in this price range. Now, most people think of volume and they think of the bars down at the lower part of your chart. But this just shows you volume based on time, like how many contracts were traded during a certain time range, which I'm not going to say is totally useless. It's definitely not. I'm going to show you a way to use it, but it's not as powerful to find levels as using the volume profile. So the volume profile has one foundational concept, and that is the value area. Now, this just means 70% of volume was traded in a given area. So this is called that value area, and it's going to have a high and it's also going to have a low. Now, on the tool, I'm going to show you how to use this. It's going to shade this area out. And what this shows you is fair value. So if the market traded within this area or 70% of the volume, that means that 70% of all trading occurred in this range. So the value area high, we're gonna look at as a premium because definitively, it is the high of where 70% of the market had agreed upon a fair price. So if you see the market reacting to these levels in a bearish way, this can tell you that sellers are in control and we're gonna use order flow to confirm that and get really high risk to reward on these trades. And vice versa, let's say if the market hits into the value area low, the way the market reacts here is going to be able to give you an inside look at who's in control. Again, remember, order flow is all about learning who is in control. So if you were to come under this level and stay under it and move lower, well, then you would say that sellers are clearly in control because there were no buyers stepping in at the low of value in a market, whether it's trading or anything. If housing prices dropped enough, people would buy them because there are people that want to buy real estate. But let's just say no one was willing to buy real estate. Well, price would go lower. That means we'd be in a bearish market. And you can use this concept in trading every single day. Now we're going to be breaking it down into two key ways. Number one is by using yesterday's profile to find bias. And I'm going to walk you guys through a full trade step by step of how I did this. But simply put, just understand if we're above value, that's bullish. If we're below it, that's bearish. If you're inside of it, we're balanced and the market is likely to chop. Typically, I don't like trading from inside the value area. Now, the way we're going to use it to find entries is today's RTH or regular trading hour profile. So this is just 9:30 a.m. to 4 p.m. That's the way I market. Some people will market to 5. I just market to the end of the stock market close. So during the day, you're going to watch the value area high the value area low, and the point of control. Okay, now back to this concept right here. The point of control is just the area where the most volume was traded. So we're going to go over some concepts such as acceptance and rejection and how to combine this with some tools you're going to use to read Delta. But for now, I just want you to understand that this is how we're going to find levels. Now let's take a look at this diagram. So we are going to hop onto a platform called Bookmap and it's going to look something like this. You guys have probably seen it. You saw in the thumbnail. There's a lot of like these blobs, almost looks like a weather forecasting thing. And a lot of people think it's complicated, but it's really not. It's just a way we're going to use to visualize order flow. So it shows you these heat maps and that is basically showing you where a lot of passive limits are sitting. So it's showing you that order book but on a chart. And this becomes really helpful when we are trying to find absorption because if we see a lot of buying and what these green and red bubbles are showing you which are called volume dots, are the aggressive orders. Remember, this is going to show you that delta, the market orders. A key concept I want you to understand is that smart money is what people will call it, but larger traders typically are trading passive because they have very large orders. And if they were to just trade at the market, they would get slipped all over the place. Like, for example, let's just say if there was only 100 contracts for sale at the best ask and there were 50 at the best bid and they're trading in here, What happens if they want to trade 200 contracts? Well, the market would have to jump back and forth to get them in a fill, and this is going to be immediately in a negative profit and loss, and they're not trying to do that. So they're going to set passive orders. But retail traders like you and I, which most of you watching this are retail traders, there's nothing wrong with that. It's a term that gets, you know, thrown shade on. But at the end of the day, we're not, we're not Wall Street, okay? We just want to trade like Wall Street. We just want to see where their intentions are, because they're usually going to be the ones in control of the market. And this is why all the smart money concept stuff ties into this, because this is a way to view that with data instead of conspiracy theory. I mean, you could literally use tools to see this. Why try to guess where liquidity's at? Why try to guess if it's a real liquidity sweep? This actually shows you if it is valid. So when we're looking at these volume dots, you want to think of it like the bigger the dot, the more the volume, okay? Not the more difference there was in Delta, but the more the volume. Okay, so let's just say you have a bunch of sellers that are coming down. So let's just say they're sellers. The market would look something like this at this time. Okay, so you guys have seen these patterns, these reversal patterns, but whenever you look at it with order flow, you will look at the market in a completely different way. So let's just say you have sellers, sellers, sellers coming in to this buy wall. Okay, and then price stalls. Now, when you have a large amount of aggressive sellers that are selling at support but price isn't moving, then that means that these passive buyers are absorbing them, and eventually those sellers will get exhausted. And this is where we have that absorption. And a really easy way to think of absorption is you want to see increasing volume into support, and then you want to see that volume end up getting overwhelmed by buyers and then decrease, and then aggressive buyers come into the market to take the market upwards. And these are the exact kind of moves that you want to catch. And obviously Vice versa for sells. If you see buyers going into a level where we have already plotted this level based on the volume profile, and you see a lot of aggressive buying into it, but that aggressive buying isn't doing anything and the market is just kind of bouncing off this level, eventually all of those buyers are going to get exhausted. And when they get exhausted and sellers step in, that's when you see the true intention of the market. And this is where you'll see panic selling and you'll get some of the best opportunities. So you want to look at Delta like the imbalance. It's the imbalance between aggressive sellers, okay? And Delta can help you. You are going to trade with Delta sometimes, but the concept of absorption is how you're going to find the initial reversal, okay? So I want you to remember this. I wanted to break this down in a simple way. Now let's hop into the tools and the settings. Now I know you guys have seen this chart before, and a lot of people think this is way more complicated. Chances are because when you start it, if you look up here where I'm clicking, when you start it, it looks like this and it's just totally unnecessary. So what these heat maps are showing you are all the limit orders in the market. You do not need to see every single one. We want to focus on the big ones. So there are literally very simple settings for this platform. Okay, you go up here, you're going to take this bar right here. You are going to drag it all the way to the right. Okay. This bar right here, which is the size of the volume dots, you're going to want to have it somewhat 2/3 of the way over. Don't trip over this, guys. A lot of people are going to be like, but what about if it's a half or a little bit more than 2/3? Don't think like that. This is literally just showing the size of the volume dots. It's, it's not that important. Okay. The important one is this up here. Now, the other things you're going to want to set up, you want to come over here and I think it has the COB. When you start, you want to right-click, you want to click Insert Column. And then it should just by default be the SVP, which is the session volume profile. And this is just going to show you over this session where volume has traded. And I'm going to show you some different ways to use this. But for now, I want to focus on the settings. Now, down here at the bottom, you have the cumulative volume delta or the CVD. And the way you want to get this in your chart is you're going to go up here to studies configuration. You're going to click that. And then you want to just click this cumulative volume delta right here. Now, what this shows you is a scorecard of delta over time. So this number being 4,500 means that during this session that the CVD is set on, there were 4,507 more aggressive buys than aggressive sells. Okay, so this can show you overall through the session where there are more aggressive buyers or there are more aggressive sellers. And just because it's high does not mean bullish. As you can see on this day, which is today, March 31st, and I'm going to break down how I caught this move, I'm going to break down a loss I took as well, but you can see that the CVD was really high. But this just means that there's a lot of aggressive buying, and as you can see, aggressive buying came right into this sell wall right here. So we saw aggressive buying, and then some sellers stepped in, we saw more aggressive buying, and guess what happened eventually? All of these buyers, they got exhausted. And then we see the real move play out because there was this passive wall of sells. Okay, so this is where the liquidity was in the market and there was more liquidity. There were more asks than there were willing, aggressive market buyers once the market got to this area. Now, if you zoom in, you can get a little bit of a better look and you can see that there was literally a wall of liquidity here. And there was a large amount of buyers. Now, if you look down here at the bottom, you see right here there was increasing buyers, right, going into this level. So there was increase of buyers, but then they were— what happened to them? They were gone. And then boom, we saw increasing sellers and the market started moving to the downside. Now, one way I like to look at finding who is in control is which side is getting rewarded. If you notice right here, there's a massive amount of buyers. Okay, massive amount of buyers right here. We see there's a lot of passive sellers. And remember, The bubbles are showing you retail buyers. Think of it like that. It's aggressive. Maybe not every single one of them is retail, but for the most part, aggressive market orders are going to be retail traders. So if we see a lot of aggressive retail traders buying from smart traders and then the market starts to move to the downside, that is the definition of a trap. Now, this was also happening at a key volume profile level in an area where I was bearish. So that is important as well. Like I said earlier, you don't want to just be watching this all the time or it'll cause you to overtrade. But we're going to use this for everything from entering trades to trailing up our stop losses really quick, getting really tight stop losses, and knowing where the market is likely going to head towards. Because as you can see down here, the market ended up moving down towards this bid wall which was developing as price got closer to it, and that is where we started to make a rebound. Now I caught pretty much this whole move right here, and I'm going to walk you through every last step of it and how to use all these tools together in a really simple way. Just stick with me. I know it may seem like a lot, but trust me, this is way simpler than you think. Now, like I told you earlier, I do like using the volume down here at the bottom of the screen. And the way that I like using it is I want to see a lot of volume because remember, volume is just one buyer for one seller. If we want to see absorption, we want to see a lot of volume. Okay, so we see a lot of buying volume, quote unquote. But at the end of the day, remember, volume is just one buyer and one seller. So if we see that the market rebounded from this area, we could say that sellers are actually in control. And then to see these kind of freefall moves, what you want to see from there is increasing volume on the selling side and then also negative delta, because now we see that everybody is selling. And this is where you get those really, really rapid moves to the downside that are very fast moving and satisfying to trade. Now, another thing that you may have noticed by now is that Bookmap doesn't have time frames. Okay, if I zoom out, I now make the time slice, which is what these little sections are, is going to be different. For now it's 5 minutes. You could zoom in to where it is literally less than a second. Okay, or not less than a second, uh, less than a minute. Maybe you could go less than a second. I don't ever go that low. But the moral of the story here, you can zoom in or zoom out as much as you want. A lot of people get tripped up in this, but remember, you're just trying to see at price levels. Okay, time isn't as important as, as price. In this example, we're looking at price and who is in control of the market. So if we see us hitting into a price level, a huge absorption, that is what you want to focus on. Now the next tool we're going to use is the volume profile. Okay, the volume profile is really simple. There are tons of different platforms you can get this on. I do recommend against using it on TradingView if you're using for lower terms of data. Because TradingView doesn't really use volume data, it uses tick data. So I use ATASX as of right now. And if you want to set up the volume profile, it's really simple. You just go up to indicators, you click right here, and then you're going to have the market profile and TPO. It's going to literally be in the favorites by default. If not, you just search market profile. And the settings that I have, I'm going to set the external period, meaning the time range that it's marked on, and I'm going to set 9:30 AM to 4 PM. So this is RTH, or regular trading hours. And what this is going to do is it's going to show you where the regular trading hours volume profile was. Now the reason for this, because if we go on and we add regular volume, you will see that most of the volume that's traded in these markets gets traded during those regular trading hours. So the goal is to get the meat on the bone. We don't want to pay attention as much in between these sessions because there's not a lot of volume there. And remember, a volume profile is based on time. So if I take my volume profile and you can get one, you can just freely mark by going right here and clicking profile and TPO, and I could just mark it on any range in time. But remember, it's just going to show me where 70% of the volume was traded during that range. And that can be skewed if in that range there's a section where there's a little amount of volume traded. And then if we go over here, there's a lot of volume traded. So an easy way to do that is just to mark a constant profile on the regular trading hours. Now, the only other settings that I would really pay attention to is to make sure that on the value area you have lines and area checked. Now, this is just personal preference. If I click line, it's just going to make them all gray. I personally like having the lines and area. Now a lot of these settings that people get tripped up in don't actually matter, okay? It's just cosmetic. Um, you don't have to trip over this stuff, guys. Just make sure you set it on the right time range and you're going to be good. Now we can break this down a little further so you can kind of understand how to use these things. I want you to notice right here that the market has a value area on this day that is up in this range, okay? So this was where fair value was established. Now I want to look, where did this market close? Okay, this market ended up closing right around here at 4 PM, right? Now that closed outside of fair value. So if the market fell lower than fair value and closed there, that is a bearish sign. Now another bearish sign is if the next day opens up under yesterday's value. So any day where you open up under yesterday's value, you're automatically going to have a bearish lean. So on this day, you would have been bearish, as you can see the market was bearish. And then what happened again? We moved down and we closed under that value area low. So the market's bearish again. So as we come into this next day over here, you can see that it too was also bearish. Okay. It's a really easy way to get a bias. If we close outside of value yesterday or if we're opening up outside of value to the downside, that's bearish. Now, on a bearish day, what do you want to do? You want to sell from levels of resistance. Now, I'm sure you may have guessed this by now, What are some really easy levels of resistance? Well, the point of control from yesterday is one. You could also have looked at this. Now, if you notice, when the market opened, we had just hit into yesterday's point of control and then you see that the market immediately sells off. So in this day, if you're in my free community, you saw me take this trade and if not, I'll leave a link in the description where you can join. But I sold from right up here and the market made a big move to the downside because I was leaning bearish. and I knew that we had reacted from yesterday's point of control. So if you've made it this far, congratulations, because you've learned passive-aggressive orders, you've learned the order book, you've learned Bookmap, a lot of stuff. But let's tie it all together into a step-by-step example. That way it's not just a bunch of theory and you actually have a checklist to trade. So let's break down this trade where I made over $10,000 in less than 30 minutes just this morning. So first and foremost, I came into the market with a bearish lean. Meaning I was expecting sells more than buys. Now, why is that? Well, because we had multiple days of regular trading hour profiles showing bearish value rotation. This meaning that value is moving lower. I mean, definitively the market is saying here's fair value. The next day, fair value is lower. This is not just theoretical bearishness. It is definitively the market is bearish. Okay. So we've seen this multiple times now and each day we're closing lower than the value area low. So that is a very bearish sign. So I came into the market looking for sells. Now I want to break down the losing trade that I had this morning because I just showed you the winner. But I did have a loser right before that. And there's a very valuable lesson in this trade. All right. So let's take a look at TradingView just for simplistic explanation on this day, which was this morning. We see the market opened up. And we had hit into this level over here. So we had hit into a key level being a swing high, and I was bearish on the day. So automatically I'm looking at this as an area where we're likely to sell off. Now, at the time, this was also the value area high of the developing day. So that was the reason I was looking for a sell in the first place. So here is that example, that blue line you see where my stop is, that is where we hit that level. So let's take a look at Bookmap so you can see why I took this trade in the first place. So as you can see, the market had hit up into that level and we saw a lot of aggressive buying. So a lot of aggressive buying into this level, more buying, more buying, but price wasn't going up. Now, this is what I talked about earlier with absorption. So we see a lot of buying at this area of resistance. And then I was getting into the market as we started to see these sellers step in and overtake buyers. So typically what I'll look for is at my key level, I want to see— if I'm trying to sell, I want to see a lot of these aggressive buyers and price not going up. Because I look at it like if there's a ton of buyers and price isn't moving, and I can literally see with these heat maps that there are a lot of passive sellers at a key resistance level, that is an A+ trade setup. The way I confirm this is once we start to see the most aggressive amount of buyers get overtaken. Simply put, when price trades under them and it does so with volume. We had increasing volume. You see right here, we had some sellers, more sellers and more sellers. So here I executed the trade and that is what you see up here. And as you can see, typically just looking at a candlestick chart, you're going to be waiting for an IFVG or something else before you get into the trade. But order flow helps you get into it much sooner. And I say that I lost this trade. But there is a lesson in this because this idea was good. I ended up making over $10,000 from it. But the important thing is that this trade was based on a good idea. So I didn't just switch up as soon as I took a loss. And guys, this is one of the most important things that order flow is going to give you is conviction, because us humans, we are creatures of wanting rational confidence in things. So for example, when I started this video, I log into my broker to show you guys I'm legit. Because there's a lot of people in this industry that aren't. Logically, you guys know that. So when I show you those numbers, when I show you data, now you're like, okay, cool, I'm going to listen to this guy because he knows what he's talking about, because you have conviction. Okay. In trading, if you're just trading patterns, you don't have conviction in that. You don't. Okay. If you have conviction based on data, if you can look at the market and say, okay, cool, well, during this day, 70% of the volume was traded in these levels. So that is fair value. And you see the market rejecting away from fair value. This means that sellers are in control. And if you pair that with the key level and what I showed you on Bookmap, that is showing you the definition of sellers being in control. And you know this based on data. Now let's look at what happened in between trade number 1 and then trade number 2, which happened after the market went up a little bit. So in trade number 1, I ended up selling right around here. Because they had a lot of aggressive sellers like we just went over. I had my stops up here and the market just didn't want to make its move. That's okay. That doesn't mean the idea is invalid. Now, what would have made the idea invalid? Well, that would have been if we saw all of these passive sellers, these heat maps, which are these walls of limit orders. Let's say if aggressive buyers pushed into them and they were able to break through, that would show you buyers are in control of the market. Because if there are a lot of passive sellers trying to hold the market down, but aggressive buyers push through, well, then definitively we're not in a bearish market, especially if that's happening at a bearish level. Because remember, we had that swing high, we had the value area high. So understanding how the market reacts at key levels using order flow shows you who is in control of the market. Again, I'm going to repeat this throughout the video. That is the only thing you're trying to do with order flow. So really important takeaway here, guys, is you got to stay confident in your trade until it's disproven. Just because you hit a stop loss doesn't mean the idea you had was wrong. Now a lot of people are going to say, oh, he's a gambler, I just take one loss and I'm done. It's just not realistic, guys, okay? I'm not here to like sell you a dream. You're going to take losses, okay? Do not, and I repeat, do not be afraid of losses. There is a reason it's called risk management, not risk avoidance, okay? Trading is built on risk. So again, if we had that huge breakout, then I would have pivoted, but We didn't. So I know that this likely means it is just a fake out. And if anything, this gives you more conviction because if we have this level and you see buyers hitting into a level and then more buyers hitting into the level and more buyers hitting the level, but what's happening? It's not moving. What do we call that? That's absorption, guys. Okay, so whenever those buyers get absorbed, the more of them that are getting absorbed, the more aggressive the move to the downside. Hopefully this is starting to make sense because chances are if you had understood this sooner, you would have been able to avoid a lot of the mistakes that are keeping you unprofitable. So let's talk about this second trade entry. As you can see right here, I reentered the trade after we had that second little liquidity sweep and that's where I got stopped out. So I got stopped out right there. I entered right back in the market. Okay. I'm very confident in this idea. This makes me more confident again for the reasons I just went over. So let's take a look at what this looked like on Bookmap. So if we zoom out a little bit, and I made the time slices bigger, we see that the market had hit back up into that same area again. So this was that first move, right? We had another move up, and we see even more aggressive buyers at that level. Now, if I want to go back to Bookmap and show you guys this again zoomed in, that was right in this area. So you saw it— look at all this volume. This is what we really want to see, because honestly, on this first move over here, I was a little aggressive. That's okay. But when you zoom in and look over here at all of the volume that occurred right there, all that volume, and then also all those aggressive buys that got into the market on the CVD. So we see that and the market just immediately halted and turned around. Now, as soon as I saw this and all of these buyers, these aggressive buyers were underwater, that is when I executed the trade. So again, we hit into this level, we see increasing sell volume. So I executed right around I want to say it was right around this $540 to $550 area. If we take a look right here, we'll be able to see it was right at that. Yeah, $535 actually. So I even got a little bit of a later entry than that. So let's tie all this together, guys. Remember, the price was rallying to that value area high and we'd hit into that swing point. Bookmap shows heavy sell-side liquidity. We'll use that term because I know a lot of people know ICT, but that's these heat maps. So we see a lot of smart money selling at this level that is stacked with a value area high. So when we see thick resting sell orders, a lot of sells, and those aggressive buyers aren't able to push through, that is absorption. And we confirm that by the down move that ensued after. That is your trade confirmation. That is your market structure shift, your IFVG, whatever it is. This is happening when the trade actually works. So again, remember, we're just trying to figure out who's in control of the market. And we know that sellers are looking to maintain control by looking and creating a sell wall at this value area high. Because if we have that volume profile over here and the volume profile has formed and the value area high is up here, remember, this is premium pricing. So where are sellers going to want to sell? At a premium. And if we see that sellers are selling at a premium and winning, you're in a bearish market. It's literally that simple. I hope this is coming together for you guys. One of my favorite things about order flow is de-risking fast. Okay, this is the only reason I've been able to grow that account from under $10K to over $180K is by really aggressively managing my risk. Now, if you notice, the trade had barely moved, but I was able to put my stops at breakeven. Now, why did I do this? And better yet, how did I know when to do it? Because there is a very mechanical way of doing this. So if we take a look at Bookmap, okay, this is where the original entry occurred. Okay, we had that absorption of buyers. I got in right around that $5.30 level, which was somewhere around here. So in this screenshot, I had my mouse over this bubble which had this data overlay right here. And you don't need to look at all the little numbers. I just want you to pay attention to what the price was. So it was $5.37 and we saw the market jet up. So notice right here, the bid-ask moved up aggressively and then it started to move down aggressively. So when you're in a trade, the way you want to think about it is where's the most recent reference point. Okay, so the first reference point, meaning the first large amount of aggressive sellers, is right here. Okay, then where was the next large amount of aggressive sellers that caused a market move? Now when I say market move, I mean we're forming structure. Okay, so that pivot point, I want to see that right there get defended. I don't want to see us get above that. So that is where I ended up moving my stops up to that level. So almost immediately I was able to remove risk. And if you were able to do this, I guarantee you guys aren't bad traders. So many people say they're bad traders and they're just not trading with tools that would make them better traders, right? You're literally trading blind without this stuff. I don't know if you've realized that or not yet, but you want to always trail your stops, okay? When volume is increasing and you see buyers push back up. So if you're in a trade, let's say here was the level, market started to move down, you got into trade right here. If the market makes a retracement, and you see a large amount of sellers sell that off, that's the new reference point because in a bearish market, bears are going to want to defend their position. So if the market hits into this level, you want to see the market move down again, right? That's where you can plot out where market structure is likely to form because the way the market's going to move is let's say you have this really big down move, okay? And you have really big bubbles to that move. Lots of sellers, okay? And let's say the biggest one was up here. Well, if the market were to move all the way back up here and hit into that level, that gives you a key level based on where the largest positions were positioned, right? So like, are they going to defend that level? Because if you see the market sit here and stall and then you can see like a bunch of, let's say, a bunch of buyers, but price isn't moving and the market moves down, that is the definition of bearish market structure. And that right there is where you can now put your stop loss. So that is what I did in this example. Now you hear this advice a lot, right, in trading— let your winners run. I remember when I read books when I was a brand new trader, I always used to think this was the stupidest advice because it was like, obviously I would love to let my winners run if I ever got one, right? But it's so true. And this is probably the most powerful piece of advice that you could ever understand as a trader. And you have to really understand how to do this, though. It doesn't mean just blindly hold on to winning trades. It means as long as a trade is a winner, let it run. Now, what is a winning trade? Well, if we're in a sell and we are trying to do what with order flow? Determine who's in control. If we're in a sell and bears are in control, you're in a winning trade. It's that simple. How do you know if they're still in control? Well, you're going to watch the way that we react to bearish positions. Okay. Hopefully this is starting to click for you guys. Now let's go into the next area I was able to trim my stops up, which is the second wave of aggression. Okay, so if you notice right here, I'm floating about $5,300 in profit, and I was able to move my stops up and secure a minimum of 30 points of profit. Now, why did I move my stops to this level? So again, right here is where I moved my stop the first time. Now, what do we see right here? The market had came down lower. And notice what you see right here. There were some passive buyers that tried to step into the market. Now, an important understanding you need to have is the difference between a true move and profit taking. Okay, so let's just say you're going to sell from up here. Okay, you're selling from right here and you had a TP for down here. That would be that limit buy. Now, if bears are still in control of the market, the market is likely going to push through that level. Now, what's going to cause us to push through that level? It's going to be aggression because we don't want to see absorption. If you just saw big red bubbles and the market started moving up, which we'll go over an example of later, then that would be a losing trade if you're bearish. But in this example, we see more sellers stepped in and we literally melted through that wall of liquidity. So we see that there is a— there's plenty for sale and there's not enough buyers there to prop it up. So if they're aggressively ready to hit that bid, remember, they're trying to hit the bid. Okay. If we see that there are more aggressive sellers, they're going to take out that best bid, the next bid, the next bid, and they're going to continuously do that until there is an imbalance of buyers versus sellers. So until then, there would be that imbalance of the sellers. Okay. So I wanted to then move my stops up. As you can see right here, we have it $23,504, which was this large red bubble right here. So I move my stops up. Now, another thing I like doing is just using round numbers. Okay, so right here I move my stops up to that $23,505 range right there. And then for the next trail— and you'll see I do this throughout the whole trade. This is how I'm getting a lot of these big trades you guys see me post on social media. And that's why I'm excited to make this video. I know a lot of people probably haven't made it this far. I really don't even care. I'm sick of doing the whole retention stuff. For you to— I just want to teach you guys what's going to actually fucking make you money, okay? Um, because this, this is the sauce, okay guys? Like, I know it may feel complicated, but it's, it's really not if you just practice it. And I'm going to give you guys a full step-by-step way to practice it at the end of the video. But understanding how to properly trail stops is important, okay? So I trailed them up to $4.70. Now this is another 30-point move. Now if you're trading just like IFVGs or something, this is literally where you're first executing the trade and you've already sacrificed— I mean, in my example, $6,400. Um, and I'm not trading with crazy size here, guys. I'm trading 4 contracts, okay? I trade with more sometimes, but just throwing that out there, it's not like I'm trading with crazy contracts. I'm just getting good entries. So I trailed out my stops again. Now, something I want to point out here is that we had 74 contracts hitting the bid. So this is creating an imbalance, and this is going to go a little bit deeper into what we just talked about. So as we can see here, we saw the market form a little bit of structure. The market came down and then we saw what we saw, a very large move without any bubbles. Now, what does that mean? Well, the way I want you to think of market structure is that the market is always moving from balance to imbalance, balance to imbalance. Okay. So when we think about it like this, in every leg in market structure, where is the amount? What is the tipping point? Okay, like what caused that imbalance? That is a really good way to look at where to trail your stops. And Bookmap helps you look at that. So if you see right here, we saw this aggressive imbalance right here. A lot of aggressive sellers right there pushed the market and it expanded. I don't want to see this level overtaken. So at that time, I then move my stops up again to that 470 level and notice how aggressive I'm being with this. Like price was right here. And when you're in these trades and it's literally running and you're able to just move up your stop, move up your stop and you know what you're doing, you unlock an entire new world of trading. Okay. This has been one of the biggest breakthroughs for me in my whole 10-year career of trading. And I've traded everything from ICT to retail to harmonics, everything, and nothing touches this stuff. And there's a reason that all institutional traders trade it. So just some recaps by this slide. You want to think balance to imbalance to balance. That is how you think of market structure. And where these imbalances happen are the reference points. Those are the true areas of support or resistance during a trend. So if you have this bloodbath down, you don't always want to just look at structure. You want to look at like what caused that structure. That's what's important. So always ask where did the imbalance start? And that is the area you want to hold if that trade is still valid. Okay. This is where you'll hear sellers are in control or buyers are in control. Now, another thing you can pay attention to here is the volume. Okay, so we see a lot of increasing sell volume, increasing sell volume, increasing sell volume. So they're not getting tired right now. As we get down here a little lower, you start to see a little bit of increasing buy volume. But don't get scared at these times because the market again is going to go from balance to imbalance. Remember, this right here is the area you want to hold in that example. Now, if the market comes up and you'll see in a second makes another aggressive move down, then typically we had to have another imbalance of sellers to do that, right? So you'll be able to watch that happen. And if we look in this example, that is how I manage my trade again. So at this time we are at $7,300 in profit. I was able to move my stops up to $23,461. And the reason I did that is because like I just talked about, so here is that imbalance right there and the market made a little bit of a move up. And what did we see? We saw absorption. So those buyers got absorbed by sellers and now we're really seeing some blood. Okay, this is where you got to really pay attention to what you're doing. Be aggressive, but don't get euphoric, right? And these moves you can get really easily euphoric, especially with a lot of profit. But I ended up trailing my stops up further because we had that new absorption. So at this point now, it's just again a total bloodbath because these aggressive buyers are attempting to step in and they got absolutely crushed. Okay, this is where you want to keep your foot on its neck. You want to be aggressive, moving your stops up, using these concepts just like you got into the trade to determine that one thing— who is in control of the market? Because you want to watch really close. Every trend comes to an end and we're going to talk about how to spot when it's likely to happen here in just a second. So if we look right here, I was continuously managing my risk. I won't bore you with all the details because it's literally the same thing again and again. As we can see, we had that move right here that got swamped by all those buyers, and then we had a little bit of a consolidation, which is that balance, and then an imbalance. Now I've moved my stops right here above this area right here again, because it's the largest amount of sellers. And I don't want to get repetitive, but I just want to make sure you guys get how simple this really is once you understand how it actually works. Now let's get into the final management, and this is the money shot. So if you notice right here, I have this line marked. Now some of you guys may think, what is he marking? Am I marking an order block? Am I marking— what am I marking here? Right. I'm marking actual liquidity. Okay. So if we want to look right here on Bookmap, notice what I spotted here with this yellow rectangle. Notice the book right here. There was an insane amount of passive buyers right now. The book's pretty thin right through here, so I know the market's likely going to rush through it because as you can see, there's no real wall here. There's nothing really stopping us. So when you see this and you know the market is bearish, you can be pretty confident you're going to have an aggressive move into this level. But once we hit this, now the bears are on trial again because now the bulls are actually ready to step in. This is where you want to see, you know, if bears really hold and push through it and aggressively move. That's— I mean, you're going to see a massive move to the downside. But a lot of times, especially if you're hitting any kind of key level, then you're going to see the market start to have its retracement because we're trying to catch the beginning of a reversal. And then we don't want to be holding through the retracement. I see a lot of traders just hold trades like this. Like, I'm not about that. I would rather take profits here wait till you get a retracement, and then see where your original trade started. See if you can get another trade, right? There's no sense in just like holding a trade and letting it turn back on you. People do that just because they don't understand how to look at the markets. But, um, you know, notice this is like actual real liquidity, okay? It's not conspiracy theory. I'm literally looking at the order book. I'm looking at it on a chart with Bookmap. That's why Bookmap is the best tool in my opinion for, um, visualizing the order book. Personally, I'm not a huge fan of footprints. I know you guys haven't heard me talk about them because you're just trying to spot the same thing. You're trying to spot absorption and you can spot that much easier with Bookmap. Okay, so again, this is the kind of area we could see trouble. So when we're bearish, we're looking for this as a target. But once we hit that market, we want to really trail up our stops because sure, we may see a big, big sell-off. Okay. I want to always hold on to the trade. I never just fully take profit on a trade. I never do that. I always will trail up my stops really tight. So the distance between where I'm at and my stops, like as you can see here, I was literally trailing up my stops so aggressively that a lot of times I'll get taken out and then the market might move without me. But that's fine. At this point, I'm floating $10K in like 20 minutes. You know, I'm not going to be mad if I get stopped out and make $10K. So now here is where I did get stopped out. And as you can see, we hit into that level and at this point it's like ride or die, right? Like, I got to see these bears better blast through this or we're going to get some kind of move to the upside. And as you can see right here, we hit into it and a lot of people will say, oh, this is breaking through it. And it's not so much what happens immediately, right? Like, remember, volume equals 1 to 1. Okay, so it is 1 buyer to 1 seller. So just because you had a shitload of volume here, that's what you expected. I mean, look, there's a ton of buyers ready right here. You're going to have volume. There has to be sellers to fill those buyers. Okay. But you want to see what happens after. And right here at this time, we saw this was right at that 394 area roughly. And then if you look at where my stop was, I just put it right above the 400 round number. So anytime we're like that close to like, you know, 390, 391, I'll just put it like the next round number. If we're heading into one of these levels. And great thing that I did. I'm very happy and you're going to see why. Because if we look right here, the market hit that level and had a huge rebound and the market actually ended up going higher than this later in the day. That's kind of what I was talking about earlier. There's no sense in just holding on to a trade like I want to catch that aggressive missile to my target. I don't want to sit around and hold on to something that's just taking money from me. That's a losing trade. As soon as you're— if you're in a trade, and sellers were in control when you got in and you're a seller and you're holding when they're not in control, you're in a losing trade. It's that simple. It's not valiant to hold your trade on to for dear life. You need to manage your trade based on what's happening. Okay, so look at that reaction right here. That was where that sell wall was. I zoomed out so the time size was like 15 minutes. So it looks a lot different. But as you can see, aggressive sellers right here. Price was not moving down, but all those passive buys absorbed it. And then you see increasing buy volume to the upside, and that's where you'll get that pullback to the upside. So let's go over this full process. First, you want to get context. Now, that is where I use the volume profile and the overall trend of the market based on value, and it was bearish. Then you want to look at the location. So this is where you're going to mark those key volume profile levels like the previous day or the current day's value area high or low. And this is where you want to look for trades. You don't look at anything until you hit these levels. Okay, so just mark out the previous day's value area high and low and the current developing value area high and low and don't pay attention to anything else. That alone will save you from a ton of bad trades. So think of that like your watchlist. That's the only thing you're watching at is those levels. And once the market hits into those levels, that is where you look for confirmation and not before. Okay, that is where you're looking at delta, trying to spot absorption. And seeing if there is a lot of passive liquidity at that level. You need all 3 of these to get into a good trade and then you execute. And we went over trailing stops a ton, so I'm not going to bore you to death with that. So again, it's just context, level, confirmation, execute. Now you've learned a lot, so I want to give you some practice, okay? Because you're not going to get this overnight, okay? If you're brand new to this, you're not going to get this overnight. It just takes a little time. But trust me, if you get this, it can change your life, okay? This is what I want you to do for the next 7 days, ideally longer, but the next 7 days. If you can't do that and you say you're serious about trading, you're a liar. Okay, it's 7 days, right? Um, you want to wait before the open, pick one chart. Okay, so I recommend just pick NASDAQ, um, so NQ or ES. These are my two favorite markets. And then just pick one session. I recommend the New York session. Mark the context and the key volume profile levels before price arrives. Okay, know these levels, have a bias out. You don't have to trade, but then during the session, watch order flow only at those levels. Don't watch anywhere else. Don't start practicing. Like a lot of people say, oh, I'm just practicing. Do you practice shooting a basketball at the wall? No, you practice shooting it at the goal. So practice the right way. Only watch it at those levels and ignore everything else. And then wait to see if you can just at least spot the absorption. Don't try to trade it. Don't go out there and just try to risk money on this until you have some confidence and a little bit of an understanding of what you're doing. And then after the session, I want you to journal it. I want you to mark down whether you thought this was a valid idea. Some of you guys are going to trade. I already know you're not going to listen to me. So if you did trade, just at least journal it and remember that repetition is what's going to build your training for your eye to actually spot this. And that's how you're going to have an edge. If you want to take these trades live with me as the market is unfolding, I do have a live trading room because I know for a lot of you guys, order flow may make sense right now, but not so much in a live market. There's a lot of tools and you may not have a clear process. So the worst thing to do is trade on your own and not be— not sure if you're actually doing it the right way. So what we do together is I use these concepts live, I break down how it's happening, wins, losses, and you see the raw reality of trading, not just cherry-picked screenshots. Okay. I try to even show you guys a loss today, but this is where you'll really get that repetition with me by your side until it feels simple. If that sounds interesting to you, click the link in the description to come trade this with me live. Now, I want to be very clear that we do not work with just anyone because it is an intensive mentorship. So there is an application process, but I'll leave the link at the top of the description. If you made it this far, I want to thank you for watching the video. If you found value in it, go ahead and subscribe to the channel. I've got this video and tons of others. I've even got a full course on the volume profile that I'll leave up on your screen right now. That'll go way deeper than what we went into today and teach you all the different concepts around it, because this stuff is really powerful. And just remember, guys, stick with this, don't give up, and just trust that you will be able to figure it out. Much love, guys, and I'll see you in the next video.










