
I Found A Secret To Fair Value Gaps
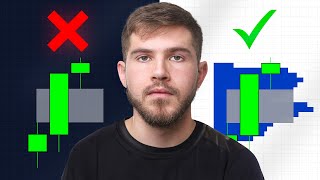
Jesse Rogers shows how to trade fair value gaps using volume profile to spot where big money is positioned. The edge rotation strategy waits for a tap of a high-volume-node edge, confirms rejection on a lower timeframe, then enters on a 1-minute FVG with a market-structure break. Targets are the next rotation point.
Chapters
Fair value gaps have been one of the biggest trends in trading over the past few years. And there's a reason for that, because they work. But here is the thing. Not all fair value gaps are created equal. I mean, look at this fair value gap right here. It didn't work. Now look at this one over here. This one worked perfectly. So why did this one work and this one didn't? Well, I'm about to show you a secret technique that I use to instantly tell me whether a fair value gap is valid or not. And, and once I added this to my trading, my win rate went through the roof and I started hitting trades like this, this, and this far more consistently. Now, before we get into that, we first have to go over what a real fair value gap actually is. Fair value gaps are simple. They're just a three candle pattern that leave a gap between candle one and candle three. And oftentimes price will return to the gap before continuing in the same direction and giving trade opportunities. In this example, you can see that that's exactly what happened. The market traded into the fair value gap and then took out the next high. Now take a look at this fair value gap. It's the same setup, a gap between candles one and three. Except for this time the market doesn't play as nice. And if you've traded FEGs for even a short amount of time, you've probably noticed that they do not always work. In fact, I ran a test using a software that I'm building and it turns out they only work about 43% of the time. And if this happened to you, then it's because you're trading invalid fair value gaps. So how do we know what makes an FVG valid? The secret is finding where the biggest traders got positioned. And there is a secret way to do this that most retail traders don't even know about. Now to do this, we're going to use a volume profile, which is what you see over here on the right hand side of the screen. And don't be intimidated. A lot of people think this is more complicated than it is, but I'm about to break it down in a super simple way. Volume profiles show you where the most trading activity happened. And inside of that is the secret that you're looking for whenever you're trading fair value gaps. And you're probably wondering, where do I set the settings, what indicator, how do I anchor it, how do I trade it? And guys, don't worry, I'm going to teach you all of that. Along with a fully mechanical Strategy. But first we need to simplify the basics. Now, these thicker areas you see on the volume profile are called high volume nodes, or HVN for short. And the best fair value gaps happen after we tap the edge of these high volume nodes. And these areas between the high volume nodes are areas where the big players who are actually controlling the market did not have a chance to get in. Otherwise there would be a lot of volume here. But since we know there's low volume, then we know that the large market participants weren't active here. These areas are called low volume nodes, or LVN for short. And the market tends to want to move aggressively through them. And what happens whenever we have aggressive moves? Well, uninformed traders act like a herd and they just chase the move. And what this results in is liquidity for the larger market participants. And when this happens, this sets a trap for retail traders and that the big players are going to take advantage of in order to create the real move. As we can see right here, volume started tapering off pretty aggressively and going downhill. We can think of volume profiles like mountains and valleys. And once you start to go downhill towards the valley, that is the beginning of the low volume node, or what I like to call the edge of value. Now, what we see happen here is the market traded up into this level, and even though it had a fair value gap moving into it, that fair value gap failed. And you could have known this ahead of time and caught this move to the downside, if you understood what I'm teaching you today. Because what happened here is that the true market participants that are moving this market are likely positioned in these higher volume areas. So whenever the market moves against them, and it's likely going to move very aggressively, if they don't step in and defend their positions and in this lower volume area, then they're going to lose money. And trust me, these big players don't like doing that. And on top of that, we want to look at these low volume nodes as an opportunity for those larger participants to get in. Because whenever the market is moving aggressively and there's a lot of market buying, meaning the herd is rushing in, that provides liquidity where those larger players can build into their trade. Because we know since there is lower volume here, they couldn't do that before. So if the sellers are still in control, once we hit the top edge of value, then we should see a rejection to the downside. And once these larger market participants absorb these aggressive traders who are falling into their trap, the market's going to make its real Move. And this is the secret to finding real fegs and avoiding the bad ones. But I want to be clear that finding the feg is, is only part of the equation. And this can harm you more than help if you use it the wrong way. So I'm about to show you a mechanical strategy that is based on these concepts. Teach you how to set up your volume profile and give you the settings I use. But first I wanted to let you that I left a link to join my free trading community down in the description. Inside there is a full free course I post my trade ideas and much more. So join using the link in description. It's totally free. Now let's break down what I call the end edge rotation strategy. I use the edge rotation strategy to catch this trade that you see here where I netted $16,000 and I risked a little over five grand to take this trade. So it put me right at a 3 to 1 return. And this strategy can give you multiple setups per day. It's stupid simple and you don't need any higher time frame bias. In fact, you could have caught the move from this edge to this one. You could have also caught the move over here where we traded under the edge. And I'm going to show you exactly how to do this in three simple steps. Step number one is you want to wait for a tap of the edge of a high volume node. So starting out on your five minute time frame, what you want to do is look over to the right hand side of the screen and look at your volume profile and ask yourself, where could I sit a book on this volume profile? So for example, let's say if we're drawing this out, you, you could probably set a book right here. You could also probably set a book right here as well. So that is a very simple way to determine whether or not you should mark it as an edge. So right here we've got an edge. Right here we've got an edge. We've got edges up here as well, but those are pretty far away. And you can mark all of these out. Now what we want to see before we take a trade again is a tap into the edge. And what I like to see is a very aggressive move in into the edge. Not just a very light tap, but you want to see a pretty aggressive candle going into that level. Because again, we want to see traders get trapped. And once we've tapped into this edge, step two is to wait for the market's reaction because we want to know are the larger players trapping these Retail traders who are aggressively buying into their trap. Now, to do this, we're going to go to our one minute time frame. And what we want to see is pretty much anything that you look for in any other trade, just a confirmation. Which brings us to step number three. How we find our entry, our stop loss and our target. And as you can see here, this is the exact same trade that I took just the other day that I'm breaking down and teaching you on right now. And step three can be summed up with just two words. We're going to look for our real fair value gaps. Because remember, fair value gaps only are valid if big players are behind them. And we know that since the market tapped up into this area where we know big players are likely to defend if the market is bearish and, and we see the market rejecting, then at this time it's safe to say that these large players are behind this fair value gap. Now, if you see right here, we created this fair value gap. But I want to be very clear that one other thing has to happen when these fair value gaps are created in order to make it valid, and that is that we need to take out some kind of market structure. As you see right here, we took out this swing low and then we stayed under it with the third candle closure of the fair value gap. This is very important. And as you can see right here, after this third candle closed, I entered on the very next candle. So as soon as this third candle closes, you can go ahead and enter your trade. Now, to plot the trade out, we can go over here to the left hand side. And since this is a bearish reaction where we hit the top of an edge like you see, and then we're moving to the downside, you can go over here to the short position tool. Because we want to sell and if it were a bullish reaction, we would use a long position. But once this third candle closes, we've got our market structure shift. We've broken a low, we've created a fair value gap away from our key level. Then at that time we're good to enter the trade. And then we're going to take our stop loss and place it right here at this high. And for targeting, it's very simple. We just want to look for the next area that we could place a book on the shelf. As you can see, that was right here. Now I want to be clear that you want to make sure to have at least 2 to 1 risk to reward on these trades. So after you've set your Levels with your target, your entry and your stop loss, you can just sit back and let the market do the heavy lifting for you. Now this is why I call it the edge rotation strategy. Because the market at all times is going to be rotating from the edge to edge. That is how the market works. Even if you're in a larger scale trend, this is going to be happening on an intraday level, which makes this perfect for day traders and trading prop firms. And this is very simple. It's based on a real FVG which is created when there's an imbalance in the market. And we know that if the market moved to an area where larger market participants are going to be forced to defend their trade, if they're still looking to push the market down, then they are going to use these traders who are buying into their trap as an opportunity and as liquidity. And when these fair value gaps are created in these conditions, we know that they are valid. And inversely, we can avoid all of the fair value gaps we see here that fail because we know that these are invalid before recap. We want to wait for the tap of an edge of a high volume node, AKA the shelf. Then we want to watch for rejection, which means the big players are defending that area with absorption. And then we enter once a one minute fair value gap confirms that they are defending this position. And we just target the next high volume node, AKA why it's called the rotation. It's rotating from high volume node to high volume node. Go test this on your charts. And there are more advanced ways to use the volume profile and other order flow tools. If you want to see more on that comment down below. And maybe I could make a full free course or something like that because this stuff is powerful. And last but not least, let's go over the settings for the volume profile and how to anchor it because this is vital. So to anchor it we're going to head out to our daily chart, which you can get by clicking on this D button right here. And it's actually not an indicator, it's been hidden right under your nose this entire time. So you're going to go over here on your toolbar like this, drop down and then you're going to click anchored volume profile. Once you click that, we are just going to count back five full days in price action. So on Monday, the day that we are trading, that wouldn't have been a full day. So you're going to go back and start counting 1, 2, 3, 4, 5 days. And once you mark this, it's going to anchor the volume profile and the data that you're looking at from this day to the current time. And that is what gave us the volume profile that we use to take the trade. Now for the settings I want you to take a screenshot of this and mark it exactly as I have it marked. So something that's very important is you need to go to inputs and you need to change the rows layout to ticks per row. What this does is instead of just having an arbitrary number of rows, it's actually going to calculate it based off of ticks and then we're going to set that row size to five. Because I'm trading NASDAQ futures volume we can set to total and the value area volume is fine to stay at 70. For the style, what I like to do is just have the up volume all one color. If you want to know the exact color I use here it is right here, you can just put that in and then here is for the value area. If you're just starting out and trading the edge rotation, then you don't need it. But later on in other content I can teach you how to use the developing point of control and the developing value area. Even though this strategy is simple, many traders struggle whenever it comes time to actually execute. And that's exactly why for a very close inner circle of traders, I trade live to show how to trade in real time and hold my traders accountable and make sure every single trade that they take is getting reviewed to point out mistakes. And we do this in our own proprietary trade journaling software. Along with this they get access to Smart Trader AI which is a private tool that I built to help traders remove emotion from their trading. Due to the direct nature of this mentorship, spots are limited. I'll leave a link in the top of the description next to the word mentorship that you can use to join. And even if the doors are closed right now and you can't get in, then you can go ahead and get on the wait list for next time. As always, thank you guys for watching. Make sure to subscribe to the channel and comment down below. If you want me to make more content on the Voluum profile or Order Flow tools, I kind of want to put together a whole free course. That way you guys can learn just how powerful this stuff is and learn how to tie it into your trading and not really replace what you're doing but but just give you a much more powerful data backed edge. So if you would like content on that, go ahead and comment down below. For now, I'll leave a video on the screen for you to watch. And until the next video, I'll see you later.










