
I Found A Secret To The First Candle Rule
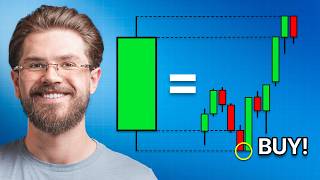
Jesse Rogers reveals how the internal structure of the first candle in day trading holds a hidden edge. By analyzing the value area and point of control using volume-profile tools, traders can spot genuine breakouts and reversals instead of false ones, then execute with a trailing stop.
Chapters
The first candle rule has taken over day trading, and there's a reason for that, because hundreds of traders are seeing success with this strategy. But after trading hundreds of these setups, I found something inside that candle that most traders never realize. And it's a big part of how I was able to turn $9,000 into over $170,000. And to prove that to you, we're going to log into my broker together. But that's not the point. The point is that after you see what I'm about to teach you in this video, you will never look at the first candle the same way again. All right guys, so as you can see, we are here on tradobate.com on a regulated broker, and I'm going to log in with you guys so you guys can see my trading results. We're going to click live trading right here, and once it gets in here, we're going to go over to the reports right here. I'm going to go back to when I started this account, which was November 5th, to date, which today is March 17th. And as you can see, $170,000 in gross profit. Total on the account is $177,000. It's a live account, as you can see right here. Now, I want to be clear that these results are not typical. I've been doing this for 10 years. You're not going to go out and get the exact same results as me. I just show you guys this not to flex, but because transparency is very important in the trading industry. If you haven't noticed already, the First Candle Rule has taken over day trading, and this is a strategy that I coined based on the opening range breakout. And it's very simple. You're going to mark the high and the low of either the first 15-minute or the first 5-minute candle and watch for a breakout. That simple. But one thing that I noticed is after hundreds of these trades, I found something inside the first candle that changes the game entirely. And what I was mainly studying was the patterns between not only the wins but the losses, because a lot of times you'll take the same exact setup, the same rule, but you'll get a different result. And then there will be some streaks of this And it's not that losses are a problem. It's just that not knowing why you're losing is because whenever you learn why you're losing, oftentimes that is where some of your biggest breakthroughs in trading will occur. So I took it upon myself to study hundreds of first candle setups. I wanted to understand why some worked and some didn't. Not just the pattern, but the logic. Now, this book right here, The Laws of Trading, is probably my favorite book ever written on trading. And it was written by a quant at Jane Street. Now, Jane Street is one of the most profitable firms out there. They make billions and billions of dollars. And this quote went something like, if you can't explain your edge, then you don't have one. And that line changed everything for me, and this is what pushed me to dig deeper and what pushed me to find the secret that helped me flip that account. Now, the quant's name is Augustin Lebrun, and his logic is that there is a 3 point system to finding an edge. And most of you guys think number 1 is just going to be data. That's what a lot of people think that firms use, but that's actually not the case. The first step for them is asking why an edge would even work. After that, step number 2 is to figure out who is losing, right? Who is on the losing side of the market? And only after they do that do they get into step number 3, which is the data and validating the strategy. Now, why does any of this even matter? Well, Because with the first candle rule, you're just going to be trading, you know, the breakout of a first candle's high and low. And this is great, but a lot of traders don't really realize why they're trading this, and they also don't realize what's happening when the market starts to fade away and give a false breakout. And right here is where part of the secret resides. So here's what we're going to cover today to unveil that. First, we're going to go over what is inside this candle. And this is a layer that separates the winning trades from the losing ones. And this is the biggest pattern that I found when going through all of the data that I was reviewing. Next, we're going to talk about how you can get two setups from one candle, not just breakouts, but also reversals. And then we're going to go over real chart and trade examples. That way you can see exactly how this works. Now, when it comes to the first candle, what most people see are the high and the low. Pretty simple. But this only tells you where price went. It does not tell you what happened inside. And remember, step one of the way that quants and professional traders find an edge is they ask why. And if all we're marking is this high and low, we don't really have conviction in what we're doing. We're kind of just trading a pattern, which is why a lot of traders have trading psychology issues. People think that they have a trading psychology issue because trading is hard and they're a bad person or bad trader. No, that's not it. It's just because you don't have conviction. Because if all you're doing is just trading a pattern through this and you don't get why you're trading it, then you're never going to have true conviction, even if you backtested it, because there's no logic to it. So what we want to see is behind these big moves, was there actually big money behind it? Because if there wasn't, this is where you're going to get a fake out. And I know a lot of you guys are sitting there thinking, yeah, I would love to know that. How do you do it? And it's not going to be some complicated system or strategy. It's a really simple tool that literally tells you with data whether they were involved in the market or not. And that tool is called the value area. Now, the value area is pretty simple. It's just where 70% of the volume was traded. So let's just say we have this candle right here and you're just going to be looking typically at the wicks and the body, right? Those are the only levels you have from a regular candlestick chart. So you're looking at these levels that are visible to the naked eye, but real professionals are looking at something different. They're looking at the value area. Now, the value area is just where 70% of the volume was traded inside this candle, and it's never going to be right around the high or the low because the reason the high or the low is made is a reaction to volume. Okay, price is more of an indicator than volume. A lot of people mix this up and they think volume is an indicator, but price is a result of volume. So if you can determine where the market was really in agreement, meaning in this value area, right, that is what we call the 70% area of the volume profile. Now I'm going to show you guys this on a chart, but I want you to understand this concept right now. If you can understand where 70% of the volume happened, if the market starts to move past this area that is the true level you want to watch. And if the market can give you specific behavior outside of this area, you're going to have much more conviction, a better entry, and overall better trades than if you wait for the high. But the real gem is what happens whenever the market doesn't get accepted and we pop back into the range. This is going to give you some of the most explosive trades. And if you haven't realized already, this happens more often than not. Now, these abbreviations you see here, the VAH, which is just the value area high, which is the high of the little box that we have that where the 70% of volume was traded. The value area low is just the low. Now, the point of control is another level that we're going to get into here in a minute, but this is the single place where the most volume was traded. As you can see, this middle bar was the largest bar, and what these are showing you is just volume at price. Typically, you would look at volume lower on your screen and it would just be bars, but that's just going to tell you how much volume was in each candle. This can show you the volume that was traded at price. Where was that volume traded? So it's much more powerful. Now the edge that I found was that one candle can give you two trades. We have our breakout entries, which is where price leaves that value area, then it pulls back, tests the area, and makes a big move. Or we have when the market fails, and again, this is where a lot of traders get burnt. And when we get a pattern that pushes us back into this range, when we can see see that the smart money is selling, that is where we can get a really good setup to the downside. Now the reason this is powerful is because we want to look at it like this: if 70% of the trading happened in that value area, that is what we want to look at as premium or discount pricing. So discount would be at the lows and premium is going to be at the highs. If you see a market that is moving to a premium price and the market is just agreeing that that's okay, meaning it's just staying outside of that retesting it and then moving higher, well, you could say that there aren't really sellers that are in control of the market, because if there were sellers in control of the market, they would want to be selling for a premium. It's kind of like an auction. If they say, hey, we've got 100, 110, 120, 130, and people are just willing to keep buying, keep buying, well, where are they going to go? The auctioneer is going to keep pushing the price higher, and that's exactly how markets work. Now, vice versa, if we are going to the downside then we are breaking out. You would be looking at it and saying, well, are buyers going to step in? Because if the market's at a discount, it would be getting bought if it was bullish, right? If you have an item in the real world that is a hot commodity, right? Like maybe it's some popular item, some designer item that is rare, whatever. There's going to be a lot of people that want to buy it if it were cheaper than it actually was supposed to be. But if no one was around to buy it, well, price is going to continue dropping. And this is what you see with like NFTs and really any asset in the world. But the point I want you to take away from this is the mechanical version of the FCR which is the first candle rule, only sees breakouts. This sees both. And not only that, it gives you a way better risk-reward and overall better entries when you do get a breakout. But the data shows that the reversal is often the higher probability trade. Let's hop right into step number 1 of what we're going to call the first candle value strategy. So first, we're just going to mark the value area, and you want to check the context. Now we're going to go over how to check this context on a chart, and to do that, I'm going to pull up ATAS. Now ATAS is a different charting platform than TradingView because it gives you real volume data. If you want to get my preset so you don't have to wrestle all the settings, I have exported it and I've left a link down in the description that you can join my free trading community, and it will be inside there in the resources channel. And once you download it, you would just go into the settings and hit import, and you'll just put in the file. On this platform, it's very similar to TradingView. Again, the only difference is it has real volume data on TradingView. The volume data is based on ticks. So let me just draw out this profile. So on this chart, you would go over here to volume analysis, and then you would hit the profile and TPO. And if you look at the time right here, this is 9:30 AM. So you want to take this whole range from 9:30 to 9:45. It would be those 3 candles. We've got the 9:30 candle, the 9:35, and the 9:40. Because we are on the 5-minute chart, as you can see right here, and we're marking out the first 15 minutes of the day. Now, the reason I'm doing this on the 5-minute chart is because this is where we're going to find our entry. So as you can see here, we have the value area high right there, and we've got the value area low. So these are the levels you want to be paying attention to. So once you have marked out this first value range, what you want to be paying attention to is how the market reacts when we dip outside of it. So as you can see right here, we traded outside of it But when the market tried to retest it, meaning it came outside and it hit back into the level, we actually came down and closed a candle back inside of it. And when this candle closed, that is an execution. So you would come over here to plot your trade and click the short position because if we hit into the high and then close back inside, you're going to want to be going short because buyers got trapped. Remember we talked about the why this works? Well, why is because we can see that the market is selling off as soon as it gets to premium pricing. Number 2 was who is wrong in the market. All of these buyers were trapped. And if we zoom in here, ignore all the footprints in these candles. If you guys want to make more videos on those, it's just profiles in each candle. But pay attention to this profile right here. As you can see, most of the buying happened down here lower in the candle. So if we know that the most amount of traders got active down in this area, but the market's moving aggressively, Well, what are these traders up here? These are likely retail traders because they can't account for much volume. They're not really, you know, pushing much mass in the market. So they're all getting trapped in the market and they're going to be in positions all through here. They're longing all through this and they're going to end up getting stopped out of this trade. And when they get stopped out of their trade, that is going to be rocket fuel for moves to the downside. Because if someone's in a long, and they're exiting the market, well, that is the equivalent to a sell. Okay. So if they're selling and then we also see smart money is selling because they're pushing back in, you can look at it like these guys got faked out and you're going to take a trade at that time and you're going to put your target where all of those people's stop loss is. Because if all of these traders got in in that first 15 minutes, well, their stop's going to be at the low of the first 15 minutes. So you're going to target that low. But right then you're not going to just take profits. and this is where my trading differentiates from a lot of people. You're going to want to start trailing your stop loss up to the candle that hit into that level. Now, let me give you an example of the trade that I actually took on this setup. Now, this is something I broke down in a full volume profile course here on YouTube if you want to watch this video. But let's take a look at this exact setup that I took. That way you guys can see what I'm talking about. So as you can see, I entered the market and the market started to move down. Every time after we hit this level, I'm trailing my stop up at each candle. Boom, boom, boom, boom. And you see that I'm able to get a much bigger trade. Now, on this trade, I was up $13,000, but I ended up getting a little bit of that taken back from me and making $11,000. But still pretty good if you ask me. But the reason I'm able to do this is because I am looking at this like a squeeze. I'm looking at this like Okay, well, these traders came into the market, these buyers up in here, but they are retail buyers. And then all of those retail buyers, all these guys up here, right, they're underwater. So the market's likely not going to move back up to where they're at and they're just going to keep exiting. And as soon as they get stopped out here, if sellers are really in control, this is like rocket fuel. So see how understanding why you're doing what you're doing is very powerful because then you can keep moving your stops up, keep moving your stops up. And right here was where I ended up getting stopped out. So if you see, it's a big, big difference from, say, where we are at right here with a 1.6 risk to reward all the way down to here with a 2.37. Now sometimes you'll be able to get even higher risk to reward on very explosive days, and I'm sure you guys can think of some days where you've had a stop out on the first candle rule and it just went insanely against you. And this can help you not only avoid those setups or avoid those fakeouts, but help you capitalize on them. Now let's take a look at another day, and both of these are recent examples. This is just on March 9th. So as we can see right here, we're going to mark out the first 15 minutes of the day. So here was the high of that first 15 minutes, and we're going to go down to that 9:40 candle, and we're going to mark right down to its low. So in this example we can see that in that profile there was the value area high up here and the value area low. So if we just want to take a rectangle and we can draw this out to have a little bit of a cleaner chart, we can just draw this out and then we can zoom out and see how the market reacted to this price action. So in this example, you would have actually taken one loss, and I'm not here to tell you guys that you would ever just have a, you know, perfect strategy. It's never going to take a loss. So I want to walk you guys through how to handle a losing day and turn it to a winning one. So in this setup, you had hit into that first candle's value area and then retested it and closed down. So I would have entered the trade right there, and then you could have put a stop loss right at that candle at its high right there, right at that retest candle's high. And then in this example, I would have looked to target down lower towards some lows over in this area. Because we had already traded under that area. If it's a breakout, I'm just going to look for the nearest lows right around that 2:1 risk to reward. If you'd like, you can just trade a mechanical 2:1 risk to reward, but I found that oftentimes you'll go a little bit further than that. However, that was a losing setup. So what do you do at this time? This is where a lot of you guys just panic. You say, oh my God, I lost, I suck at trading, I'm gonna get on YouTube and watch another strategy video. No, We're not going to do that anymore because once you understand the why, you can say, hey, look, okay, cool. Well, sellers really tried to push the market down here. Now let's take a look a little bit deeper at this profile. We can see that's pretty, you know, it's not balanced. It's definitely not a balanced profile. But there's not any, you know, there's not a huge amount of sellers down here. There's also not a huge amount of sellers up here or traders up here more so than there are down here. So you could say that at the end of the day, if the market can really start to pop back into this range, there's not really a reason why you shouldn't take a buy. And a lot of traders will say, oh, that's overtrading. It's genuinely not. You know, sometimes you're going to lose a trade and you're going to say, hey, I was wrong, and be able to take a trade in the other direction. I know that whenever I first started trading, I was really scared of this and I felt like this was gambling. But at the end of the day, guys, like, this is trading. Um, so the first setup you could have taken here, the first long, is that once the market started to close back into this area, you could have taken along right here and it would have had a kind of a wide stop loss, but you would have put your stop down at this low right there and it would have worked out. You could have just targeted up higher and let the market kind of run and do its thing. And you could look over here. And what I like to do in these setups is kind of just look over to the left and see if there's any key levels. Now, here we had a gap right here. You could have just traded this towards that gap fill and then started to trail up your stop loss after that. Now another setup you can do, and you can also just use a fixed 2:1 here, but on these kinds of setups, like if you have a really big move in the morning, sometimes I like to just look for some kind of key level over to the left. Now another setup you can look at as well is if you missed that one, did you get that breakout? And this is how you can look to spot a breakout. In this example right here, you want to think of it like, okay, well The market not only, you know, trapped sellers, right? We saw sellers step in, they were trying to sell off for these, you know, discount prices, but buyers finally stepped in under all these lows and then pushed the market back up. So you can say from that happening, buyers are in control. Okay, if buyers are in control, what do you want to see happen at premium prices? So let's say if we get right into this area, which is what we have determined as premium prices based on that value— we didn't determine this, the market said that, it's a value area high. So if the market gets above that and closes and starts to really form an aggressive move to the upside and stay up there, anytime you have some kind of move down, that is where you're going to want to take a trade. So in this example, we went down into a fair value gap. Now, if you don't know what a fair value gap is, it is just the gap between candles' wicks. So notice how this candle right here, its high did not touch this candle's low. So this candle was expansive and it formed a gap. So as soon as you start pushing outside of the first candle's value and you start to form key levels, if you dig back into one, you can take a trade there. And then on these kinds of trades, I like to just trail my stops up and not really take profits. Like, I, I'm not a big, uh, profit taker. Like, I, I would rather, for example, once we get something like this and we get this engulfing right here, I would just enter the trade and I would keep my stops here to start and I would just have an open TP. Like I'm literally just going to let my trade run. And if the market starts to make a big move up, right, as soon as we make this pop up and we're trading momentum, I'm moving my stop to break even right now. A lot of people get scared and say, oh, it's too, too early to do that. I don't care. Like I would rather just be aggressive moving my stop up every time. Like we make a swing low and move up, I'd move my stop right under that low again. Let me just delete this. You can see I'd move it right under that low again. And then every time we make a swing low, I'd move it again and again and again. And this is going to help you a lot of times get way more out of your trades than just letting trades turn around and come back and stop you at breakeven. So the reason for this and the reason that I would do this in this example is because we have a lot of energy, right? If you, if you're seeing a lot of energy in the market, you've already seen one side wrong. You have your why, you have who's wrong. At this point, you don't really want to see the market wait around a lot. So these are kind of tips that, you know, typically with these videos I make them like really stupid simple and just go 1, 2, 3. But I really want to start giving you guys a lot more value here on the channel and going in a lot deeper. So hopefully you guys enjoy this. Leave a comment if you like this kind of deep dive explanation. Remember, step 1 is to mark the value of that first candle. Step 2 is to wait for a breakout reversal. And step number 3 is to execute and manage the trade. And when I say manage the trade, I mean use your trailing stop loss. Another way you can use stop losses in this strategy is you can actually put it at the value area high. This gives you a lot better risk to reward. As you can see, this increases that significantly. So if you're trading a reversal and you're hitting into the value area high, you're coming back down, you can put your stop right there at that value area high. You now have everything you need to go out and trade this in the markets tomorrow. You have a full strategy on how to execute using what you've learned. But I want to be clear. Having a strategy is the easy part, which is why I built my mentorship the way I did. Inside, you have someone trading with you live 10 sessions a week if you need it in the London and New York sessions. You have somebody checking every single trade that you take in our own proprietary app, giving you direct feedback on all of your trades and correcting your mistakes. And you get your own coach assigned to you to hold you accountable to going through the process. If you want to apply to work with me in my mentorship, I'll leave the link in the description. I want to be clear that not everybody gets in. So if the link isn't working, then that means the enrollments are closed. But as long as it's working, there are still slots remaining for this enrollment. And regardless if we work together or not, I am rooting for you to win. And truthfully, you can do this on your own. That's pretty much how I did it. It just took me many years. So I do offer the mentorship if you want a fast track and learn from my mistakes, but by no means you have to do it. I'm going to always post a ton of free content here on YouTube. Again, I have a free volume profile course that is super long and goes over everything from the basics to advanced applications of the volume profile. So if you want to learn more about that, I'll leave a link to that in the description as well. Make sure to subscribe to the channel if you found this video valuable. Thank you guys for watching, and I'll see you in the next one.










