
ICT + Volume Profile = Profit
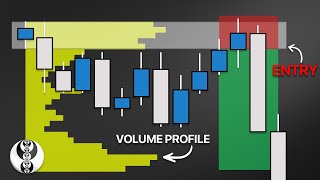
Jesse Rogers combines ICT smart-money concepts with volume profile to filter trades. He walks through a $16,000 short trade example and shows how to anchor volume profiles to the last five days, using specific settings for Nasdaq and ES contracts.
Questions this video answers
January 5, 2026
$16,000
Five full trading days
5 ticks per row
10 ticks per row
Chapters
Using ICT with the volume profile works so well that it almost feels like cheating. And if you're trading ICT but still not profitable, it's not because you're a bad trader, it's because you're trading blind. Once I combined the volume profile with ict, I started having days like this, this and this consistently. And today I'm going to show you exactly how. We're going to go over everything, including what the volume profile is, how it works and how you can start using it with well known ICT concepts to level up your trading. But first, let's talk about why most ICT traders fail before they even start. Let's start today off by playing a game. Which liquidity sweep is valid? Number one or number two? Now I want you to take a close look because both of these setups are nearly identical. Okay, time's up. If you said number one, you were incorrect and if you said number two, you are correct. But why? I mean, they both had confirmation, they both hit into a swing point and we saw an inverted fair value gap. But one worked and one didn't. I want you to bookmark this in your mind because we're going to come back to this later. Now let's take a look at these fair value gaps. Which one of them is valid? We can see that a lot of them worked, but a lot of them didn't. Now let's take a look at these order blocks. Which ones are valid and which aren't? As we can see, only about half, half of them worked. Now if you haven't already figured out as a trader, maybe you realize in this presentation that ICT concepts can work, but they're just based on theory and pattern recognition. You have no way to determine whether you're trading a low probability ICT concept or a high probability ICT concept. And the truth of the matter is you need years of screen time to develop a feel to trade ICT successfully. And by the time you do that, you might end up looking like this guy. Now I know this because I lived it. I spent years as an ICT trader. And yes, you can make money with ict, but it will take years of struggling. And even though I was able to make money with ict, adding volume profile to my system has given me an edge like never before. As you can see, I still am having winning days. They're just much, much larger. Now I stumbled onto this after trading years for ICT and I started thinking, what if there was a way to track this so called smart money and stop trading blind? And this is where I discovered the volume profile, which I like to look at as the data behind smart money concepts. Because the volume profile shows you where the most trading activity happened. Not by conspiracy theory, but by actual volume data. So let's break down the basics of the volume profile in a simple and easy to understand way. Through high volume nodes we can literally see where the big players, AKA smart money, got positioned. Now a trick I like to use when determining whether or not a volume area is a high volume node is that if you could set a book on it, it's a high volume node. Think of them like shelves. And then we have low volume nodes which are areas where the big players avoided. So we know that there aren't smart money positions built in these regions of price. You can think of these like valleys between mountains. And my favorite concept about the volume profile is called the edge of value. Now this is where high volume nodes start tapering into low volume nodes. You can. And this is where we will see the most amount of smart money activity. You can look at these as the downhill slope into the valley. An easy way to look at the volume profile is that it's harder to climb mountains. Take it from this guy, he said that climbing these mountains is exhausting. But it's easy to roll downhill into the valley. Like he said, easy mode. Don't take it from me, take it from this guy. But sometimes you get to the top of the hill and say no chance and turn around and go the other way. And that is where things get interesting. This is where smart money leaves their footprint market. ICT teaches you to follow the smart money. But how do you know where they actually are? And if you are anything like I was whenever I first learned ict, you're trading every single liquidity sweep. You're trading every fair value gap that forms. You're looking at every single order block that you see. And essentially you're just guessing which setups are real. But the volume profile shows you the truth. If we know that institutions control 80% of market volume and that volume profile shows you where they're positioned, then we don't need to trade with discretion. We don't need to trade with feel. Instead we trade with data. Look, ICT had the right idea. Follow the smart money. But without the volume profile, you're effectively trading blind. ICT shows you patterns in the volume profile, shows you where those patterns actually matter and helps you avoid the losing setups. And by combining ICT in the volume profile, you can you finally actually start trading with the smart money. Now we're going to break down how to combine ICT in the Volume profile in three simple steps. Number one is how we use it with liquidity sweeps. Next, we'll talk about fair value gaps, and finally we'll talk about order blocks. Let's hop right into step number one, which is liquidity sweeps. And this is where most ICT traders go wrong before they even get started. So what is a liquidity sweep? Well, the idea is that price runs stop losses above or below obvious swing points. Now why are there stop losses there? Well, the idea is that everybody sees these obvious areas and that's where they're going to put their stop losses. And then institutions are going to sweep those stops to enter their positions. So if all the retail traders have their stops here and the institutions know that, they'll then run price down into this level. That way there's enough liquidity for them to get into the market and move the market where they want it to go. But in case you haven't figured out already, most liquidity sweeps fail. Now, the reason why is because that if smart money isn't indeed active at the level, then the level won't hold. Not every single swing point is going to provide a liquidity sweep, even if you wait for proper confirmation. So remember these two liquidity sweeps. Why did this one work and this one didn't? I mean, both of them had an inverse fair value gap confirmation. They were pretty much identical. Or were they? But when we add the volume profile, it tells a different story. Notice how both of these happened at edges of value. Now why does this matter? Well, because smart money leaves a paper trail with high amounts of volume. I mean, think about it. If we're trying to track the smart money, who is, you know, all these institutional traders, they're probably going to be entering a lot of trades and thus leaving a lot of volume. So this gives us a clue because we can see whether buyers or sellers are in control based on these reactions. And at smart money's position. Notice here we had a sharp reaction to the bottom of the edge of value. This shows us that buyers are in control. Because if a lot of buyers are active in this area right here, and the market goes under their position, they're going to want to defend it and push price higher, as you see happened right here. But then if we take a look at the next edge of value, no seller stepped in to defend it. So this can help us confirm even further that buyers are in control. And the same thing happened at both of these edges of value. The market pushed through them, even creating fair value gaps, and didn't give any Sharp reaction. Think of it like this. If we know that this is where smart money is positioned and we're trying to determine who's in charge of the market, if it were sellers, they wouldn't let the market just rush past all these levels. They would step in and try to defend their positions like what happened here. But as we can see, buyers are in control because they defended this level. And that is what makes this a good liquidity sweep and what makes this liquidity sweep invalid. So remember, liquidity sweep, where smart money is positioned plus a confirmation gives you a valid liquidity sweep. And even if you have a liquidity sweep plus a confirmation, if smart money isn't positioned there, then that's likely not a liquidity sweep and it's going to fail. So the key insight that I want you to take away from this is that the volume profile shows you where ICT concepts actually matter and helps you avoid the bad setups. I want you to ask yourself, if you could avoid just half of the bad setups that you take, would you be a profitable trader? So there are three main takeaways from step number one. First, you need to remember that most liquidity sweeps aren't actually liquidity sweeps and there's no smart money involved. Next, remember to only trade sweeps that occur after trading into the edge of value. And if you're not fully clear on what that means, don't worry. We're going to hop on a chart and do a full trade breakdown and go over all of this later in the video. And last but not least, always use the volume profile to filter out the noise and the bad setups. Now let's hop right into step number two, which is the most popular concept in trading, the fair value gap. But first, I wanted to let you know that I have a free trading community on. I'll leave a link down in the description that you can use to join inside. I post a ton of value, have a free course, and I post my trades. So again, use the link in the description to join my free trading community now. Now, unless you've been living in a cave or are totally new to trading, you've probably heard of fair value gaps and how everybody talks about how they're the best setup in the world, but the data says otherwise. Studies show they only work about 43% of the time. As you can see here. I ran a test on fair value gaps. So now this was done over a 10 year period on Nasdaq and it shows that they only work 43% of the time. 57% of the time they're traded through and are meaningless. So you're essentially just flipping a coin, except you have worse odds than flipping a coin. And it's not surprising because you're just trading some random visual pattern with no context. So you're trading blind. And again, you're flipping a coin. But you don't look as cool as this guy. You look more like this guy. In case you didn't already know, a fair value gap is just a three candle formation where price moves so fast that it leaves a gap between the first and the third candle. Now the idea behind these is that smart money created this imbalance and that there's liquidity inside of the gap and it's going to act as support. Or if it was a bearish one, it would act as resistance. But there's one problem with this logic. Because if that were really the case, then why would over half of fair value gaps fail? Well, there's a couple reasons. Number one, like I said earlier, you're just trading a visual pattern with no context and you don't really have any way to know which ones actually have smart money behind them. And random fair value gaps form all the time during normal price movement. Now the good news is there is a simple and effective way to spot the best fair value gaps. You guessed it, fair value gaps that form after high volume node edge taps. Because remember, smart money leaves a paper trail with high amounts of volume. This gives us a clue. We can see exactly which fair value gaps are actually created by smart money when we know where they're positioned. Simply put, fair value gaps are only valid when they form after tapping the edge of a high volume node. As we can see here, these fair value gaps failed. But this one worked. And the reason was because this was the result of smart money defending their positions. We see the market traded down low into this area where smart money would end up going into the red if they didn't step in. Because if we know they're positioned here and they are actually in control of the market, we don't want to see the market go too far where they're in the red. You know, smart money isn't in the business of losing. So if we see them step in and push the market aggressively, creating fair value gaps, we can be almost certain that those are going to work. Just like we saw over here, we hit into another high volume node, we traded through it, and then once the market traded back down into it, we saw our reaction creating a fair value gap. And this fair value gap pushed Price higher. Now, why is this so powerful? Well, again, high volume nodes are where big players are positioned. And if we know where big players are positioned, then we can read the market like a book. Because if buyers are in control, we're always going to react aggressively from the bottom of high volume nodes and we'll push aggressively through the tops. Now, if sellers were in control, you would see a reaction from the top of a edge of value, and you would see the market push down with no problem through the bottom edges of value. So even if you're using a liquidity level with a fair value gap, they're likely to fail because there's no institutional backing, AKA no smart money. So let's take a look at this setup over here. Even though there was a liquidity level where the market hit into it, and then we move to the downside, creating a fair value gap. This is not a good fair value gap because it happened in an area of low volume. So if there's not much volume, then we know that smart money wasn't active in this area because smart money leaves a paper trail. But then we can see that price trades up here into the edge of value. And this is where sellers are most likely positioned. And if those sellers are still in control, once the market hits into this area, you should see a displacement to the downside, which we did, and we saw a fair value gap. So this fear value gap worked because its key level was actually institutional backing and there were a lot of traders positioned at the area where it originated. Now there's a golden rule and an easy way you can actually make money and trade using this ideology. And that is that when price creates a fair value gap away from one high volume node, it's likely going to go down to the next. And understanding this unlocks a new world whenever it comes to day trading, because there are tons of different opportunities that you're missing by not understanding this. But the good news is you're here now. And as for this setup that you're looking at, this is not just some random hindsight example. This is an actual trade that I took and made $16,000 off of. And we're going to break this down later whenever I put all of these concepts together for you into a clear strategy. So key takeaways about the fair value gap with volume profile, Remember, only trade fair value gaps that form after an HVN tap, because this shows us that smart money is involved. This alone will filter out 90% of invalid Fair value gaps, and it keeps you in the highest probability setups that way you look more like this guy who and less like this guy. All right, so we have now gone through steps number one and two, and it is time for the order block, which is one of the most slept on ICT concepts. So simply put, ICT says that the last up candle before a down move is a bearish order block, and the last down candle before an up move is a bullish order block. Pretty simple. But the problem is this definition is too vague and you will find order blocks everywhere. I mean literally everywhere. Every single swing leg will have one. And obviously that's not a good way to trade. As you can see here, a ton of these order blocks failed, whether they were bullish or bearish, and less than half of them worked. So let's play another game. Which one is a valid order block number one or two? Well, if you said number one, you were wrong. But if you said number two, you are also wrong. Good news is you're not stupid. You don't suck at trading. And surprisingly, the tools that you're attempting to use do work when used correctly. Simply put, a valid order block just means an area where institutions participated. So the idea of an order block in ICT is that smart money pushed up the market to create liquidity and they were buying, buying, buying. So that way other traders would jump in and buy two that they could then sell in reverse on the market. Right, that's the idea. Now, what we want to pay attention to with order blocks, because order blocks are a real concept, most people just trade them. Totally wrong. As we can see right here, there is a high volume node that lines up with this order block. So when you have order blocks aligning with a high volume node, you have a valid entry zone. Because when you look at this price example, there are tons of order blocks that ended up failing. And the reason that they failed was because they occurred in a low volume area. So we know by data that smart money wasn't involved. When we look up here, we can say that there was a lot of volume that pushed this move down. So this is likely the order block. And as you can see, the market reacted from this level with pinpoint accuracy. And this tells us that the sellers who are positioned here are still in control because they stepped in and defended the market, pushing it down. It's really as simple as that. So let's go over some key takeaways from step number three before, before we hop onto a chart to go over the live trade example. Real order blocks are always hidden inside high volume nodes because we want to Trade order blocks created by smart money. And the only way to do that is to follow their paper trail. So again, we only want to trade with a smart money and not randomly. Last but not least, order blocks in low volume nodes are expected to fail. So now you've learned how to supercharge ICT concepts, but without a clear way to actually use these, you're going to be in the same place that you were before you watch this video. And if that happened, then I suck at making YouTube videos and I like to think I'm pretty good. So let's hop on a chart. That way we can break this down step by step in a simple, clear, mechanical process. That way you can walk away from this video a better trader than you were when you started. So as you can see here, this is my trade of 8 account. You can check up here at the top. Right. And I made $16,000 on this trade. This is the same example we went over earlier. Now let's hop on trading view so we can break it down with the volume profile. So as you can see, this trade took place on January 5, 2026. And here we are on January 5, 2026. Now, the first step to this strategy is getting the volume profile on your chart. And we're going to go over the settings and all of that, but the way you anchor it is very important. Now to do this, we're going to head to our daily chart. So go up here, click the D, and this is going to put you on the daily chart. Next we're going to go over here to our toolbar. On the left you're going to click this drop down. It's the same area. You have your long and short position tools. Then you're going to click the anchored, not the fixed, but the anchored volume profile. After you click this, you're going to want to count five full trading days. So at the time I was trading, which was Monday, that day was wasn't completed. So we wouldn't count that day. So you would go one full day, 2, 3, 4, 5, and then you click right here and that is going to anchor the volume profile. So it shows the last five days of trading. Now if we look at the market just before I took this trade, we can see the market is approaching this high volume node. So remember, all the good trades we want to take are going to happen at these edges of value. Okay? So we want to think, where can we set a book on these shelves? So here would be one, here's one, and so forth. Okay. It's A really easy trick. Just act like you're putting a book on it, if you could. Then it's a high volume node. Now what we want to wait for is the market to trade into these levels. Now I'm on the five minute chart, which is my preferred chart to watch the market until my key level is hit. If you sit on the one minute, whenever you're not looking for a trade, I think it can lead to over trading. So always wait until you've actually traded into your level to go into the one minute. Okay, so we're watching right now. The market then trades up into the level. And this is exactly what we want. We want an aggressive push because we want to think of it like, you know, retail traders have to be fuel for the move. Okay? So these lower volume areas typically are going to provide a quick move. So retail traders, as soon as we break into these areas, they'll start to try to scalp. And what this does is it creates a nice push. And this sets up our opportunity because remember, we're waiting till we trade into this high volume node, or the edge of it, I should say. And then we want to see does smart money, who is positioned here, defend their position? Because over the last five days, if we know that a huge amount of volume has occurred in this area, then if sellers are in control, that means there's a lot of sellers here. Do we want to see the market move past them? No, we want to see them step in and defend. Because if they step in and defend, then we know that it's likely a smart money move. So as we can see here, the market kind of hangs out here for a second, that's totally fine. And then we see a nice push to the downside. Now this is where you combine it with what you already do and you just look for these patterns, right? We have like a market structure shift. You have your fair value gap like we talked about before. So this is an actual valid fair value gap. Also, if you look over here to the left, we have an order block that occurred in this high volume node. So like I said earlier, order blocks that occur in the high volume node, we can look at that smart money is involved here. Because I mean, think if we know there's a lot of volume here and the market's just now trading up here, so this volume is from somewhere before. Well, take a wild guess at where a lot of volume of selling may have happened right before the market started tanking. So we know that this position right here is likely going to get defended. So the market was trading into this order block, into the edge of value, and we had little liquidity sweeps on our lower time frame. As you can see right here. We were taking out highs right here, highs right here, highs right here. And we had our fair value gap. So all of these things combined can give you a huge edge in the market. And as you can see, this is right where I entered the trade. So as soon as this candle closed and confirmed the fair value gap, the next one opened up pretty aggressively. And right around that time, I entered a short position. I then put my stops right up here at this level. And the target is very simple. I just want to see us trade down to the next high volume node. So what I like to do is I'll put a rub target. But I never really just exit the trade when it hits there. I just start trailing up my stops really aggressively. As you can see here, I marked out this position size tool to show you where I exited. But really I exited over here because I trailed my stops up as we started to push through these levels. Now why did I trail my stops up? Well, the way that I like to look at it is you don't want to be too greedy. You don't want to just let your trades run forever. But once the market runs pretty aggressively and it hits into some of these high volume nodes like you see here, the market is eventually going to likely get some kind of bounce and some kind of rebound. So again, you're just looking for the market to rotate from high volume node to high volume node. This is why I call the edge rotation strategy. Because we hit here, sellers are in control. Where are they likely to push it? Right here or right here? Somewhere in this area. So once the market hits down into those areas, we want to see does the market have juice to keep going and we can protect ourselves while also allowing ourselves to have a really big move in the case that that happens. A lot of you guys may see me post a lot of these huge trades. This is exactly what I'm doing. So as we can see here, the market had a nice displacement down and after we hit into a high volume node like this, so we hit into this first high volume node, you'll kind of consolidate. That's to be expected. If you start to push down and have big forceful moves through it, you want to trail up your stops because the market might end up doing an edge tap in the other direction. Now you'll get really good risk to reward doing this. And sometimes the market will just run and run and Run and run. And that's great. As you can see, in this trade I ended up exiting right around 1:24pm so we had that big displacement down. I had trailed my stops up once. Once we had another displacement down, I trailed my stops up again to the beginning of it. I would have moved them here and then once we made another move, I moved them there. And after the market came back up to that area, that's where I was tagged out on the trade. Now this means that I was able to net about 3 to 1 risk to reward on this setup and it did not take a very long amount of time. And also one of the things that I love about this strategy is you will very rarely have much drawdown. And early on into this trade, right when we had this displacement down, I was able to move my stops to entry and de risk. Now let's talk about the settings for the volume profile. But first I wanted to let you know that at the top of the description I left a link to apply for my mentorship. Inside you'll learn everything that I know and have learned over the last nine years I've spent as a trader. That way you can avoid the mistakes that I made and become successful much sooner. And you'll get live trading every single day in both the New York and London sessions. On top of that, every single trade that you take is reviewed to make sure you're doing things correctly. And you'll get access to the smart trader AI software which has one goal, to remove the emotion from your trading. And I'm so confident in this system that I built the double down guarantee where I buy your first prop firm account. And if you do everything I say and still don't get funded, then I will personally trade with you until you are. Again, the link is in the top of the description next to the word mentorship. I want to be clear that this is not for everybody, it is for serious traders and it is an intensive mentorship program. So if you're somebody who takes trading seriously, click the link in the top of the description. So now for the settings of the volume profile. What you want to do is make sure you go to inputs and you set rows, layout to ticks per row. We then want the row size if you're day trading Nasdaq to be 5. If you're day trading ES, you could make it 10. We want volume to be total and leave the value area volume as the default 70%. As for the style, all this stuff is really cosmetic. You can just select it. I literally just make it all one color, pretty simple. And then for this stuff we can go over in a later video. If you guys want me to make a full in depth course on volume profile, let me know. I released one guide that was like an hour long, but to be honest, I want to put together something that is probably multiple hours long for you guys. So if that sounds like something you're interested in, go ahead and comment down below and let me know. I hope this video is helpful to you and helped you break down what most think is a complicated concept and into a simple and mechanical strategy. If you enjoyed this video, go ahead and subscribe and I'll see you in the next video.










