
Live Day Trading Gold Futures (CPI Day)
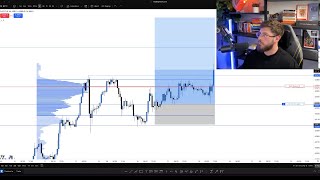
Jesse Rogers walks through a live gold futures trade taken around Dec 16, 2025, demonstrating a mechanical method using a 5-day rolling volume profile to identify high-volume price levels, consolidation/acceptance, and displacement thrusts as entry signals. He ties the trade idea to macro drivers (CPI release and expected Fed liquidity/printing) and explains stop placement and trade management while the trade unfolds live.
Questions this video answers
December 16, 2025.
$160 billion.
Chapters
What's going on, guys? So currently I'm floating on a big gold trade. As you can see here. I'm going to break down a very simple way that you can find trades just like this using real market data and literally being able to see where the largest positions are likely in the market. And this is not some kind of ICT gimmick, this is literal data. So this tool you see over here is a volume profile. A lot of people are very confused and they see these, they think it's some complicated mess. But in reality all it shows you is at different levels in price, where is the most volume traded. So as we can see right here, there was a lot of volume traded here. But what you're looking at right now is not why I originally got into the trade. The reason I originally got into the trade was because what it looked like whenever I entered, which was on Wednesday. And I posted this in the free discord, as you can see right here. This is literally posted before I took the trade, right whenever I entered. And this is what the profile looked back then. So let's go back and break down the logic for why I entered the trade. So if we're going to do that, we want to go back in time. So I'm going to hit the replay button right here and I will click back to when we entered the market, which was on the 16th. Now what we can see on the 16th is that the profile looked a little different. Now the way we're going to mark these profiles, I'll just delete this one so we can, you can actually see the process. So you're going to go into your indicators and you're going to get the fixed range volume profile. Once you click that, there are a million different ways you can use this. I could draw it on all this price action and it would show me the volume traded. But I'm not worried about all that. I want to keep it mechanical. So what I do is I take a five day rolling profile, counting the developing day. So what would a developing day be? Well, it would be the day that is current. Whatever day, you know, today for example, is still developing. It's not closed. Now the closed days, we want to have five of them. So we start with the current day. We go 1, 1, 2, 3, 4, 5. Okay, that's the profile that I'm watching because that is where I want to be paying attention in the market. I don't want to be paying attention to tons of other stuff. So as you can see right here, if we move this Volume profile over to where I entered the market, we can see something pretty interesting. And I know a lot of you guys are going to think this is more complicated than it is, but bear with me. So right here we had a consolidation. So. So in a consolidation, what's happening? Well, the market has established fair value. Both sides have agreed this is a fair price, and it doesn't move until there is an imbalance of buyers or sellers. Now, if there is an imbalance of buyers or sellers and we're hitting into some kind of key level. So if we look at the higher time frames over here, there was this point of structure, so we had an imbalance of buyers and sellers, showing that this accumulation, the buyers took control and won, so to speak. Now, once buyers won, they hit their target. But I am more interested in what happens after that. Because once we hit into a key level, you need to watch for something that I call. Well, I don't. I didn't make this up. That is called acceptance. Meaning once the market hits into this area, what happens? Does the market sell off? Like, the market hit into this and we just hang out and then go higher, Right? The market tries to pull down, we stay above, we pull down, we stay above. This is showing along with. See how we're establishing volume above this area. So we came above this new area. A lot of volumes being traded, but we're not selling off. So that tells me that the market is accepting this new higher price and we're likely to go higher. This is literally how markets work. This is how the market is always going to work. It's how it always has worked is where there's going to be imbalances of buyers or sellers. Now, if we see that we hit into a key level of liquidity and there's nobody taking up that and selling the market off, well, we can go ahead and lean towards the idea that the market's probably bullish. Now. We always want to combine that with price action. And what I was doing was watching that previous high, the way we were reacting to it, and watching market structure. Now, for those of you who are newer to the audience, you may not remember, because I haven't talked with this in a long time, but we have something called manipulation versus displacement. So whenever we're looking at structure, we want to not necessarily pay attention just to, like, a little wick like this. We want to pay attention, like what happens once the market hits into structure. Because if we look right here, the market hit this structure. And what happened, we pushed through it really aggressively. We Created fair value gaps and the market was had some follow through. What happened here? Same thing. That's a bullish market. Just because we wick under this level, that is not bearish to me. If anything, this is more bullish because I look at it as any opportunity there is to buy. The buyers are stepping in and sellers are failing. They can't even make a new low. So we see this happen continuously. And also we had CPI coming up this week and I've talked about in the free community why I think the markets are going to be bullish Q1 and why we're going to get hyperinflation because the Fed is literally telling you that they're going to print $160 billion and this is while the market's at highs. This is while inflation isn't necessarily where it needs to be. Now at the time of this, inflation did come out better than expected today, however, it's an interesting time for the Fed to be printing money. So when that happens, what does inflation do? It likely goes up. And when inflation goes up, guess what happens to gold, the hedge against inflation? It's probably going to go up. Now there is the argument to say that this whole run up that we've had was based on that, right? Like we've had this massive move up on gold over the last few months. So maybe the entire reason that we had this run up to the 4,000 was based on that. It's already priced in. But I look at it like we're most likely going to see another high now. Who knows, I could have been wrong, but that was the overall basis of the trade. And then on top of that we had this nice really big displacement again off this high. To be honest, if I'd been paying attention I would have entered over here in this area, but I entered over here. And then we can go back to the live market to show you how this trade is doing. Today we had CPI and had a pretty decent sell off. But at that time my stops had been moved up a little bit. But I didn't panic, I didn't do anything stupid, I just kept things mechanical and that's what I'm going to continue to do. I'm going to continue to watch the market, see how we react, manage my stops and at the worst case scenario this trade reverses and I make around five grand, which would be a low R multiple. Hopefully that doesn't happen. And I'm showing you guys this trade as it's unfolding not just like after, it's only a Huge win. I posted it for free before I even took it. But the main thing here I want you guys to take away is not so much the profit or anything like that. It's more so the understanding of why I did it. Because this can tremendously help you. Now, what I'm paying attention to moving forward is this right here and how we react above it. Because like I said, I want to see follow through. If we don't really see follow through here, I don't know if I want to be in this market. And that's why I have my stops just under this big displacement candle. So anytime you have structure and you hit into the market with a lot of force and you get a thrust candle or a displacement candle, you want to move your stops up or I like moving my stops up right there. Because I want to trade momentum. I don't want to, you know, just wait for the market to come back down to my entry. Now if and if the market does that, does my idea become invalidated? Not necessarily. And I can always re enter a trade, but I'm protecting my capital in a logical and mechanical way. So, you guys, hopefully this was helpful to you all. I haven't posted one of these recaps in a while, but yeah, thanks for watching. Make sure to subscribe and I'll see you in the next one.










