
LIVE TRADING The First Candle Value Strategy
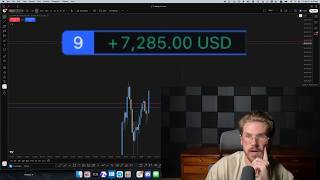
Jesse Rogers trades the first candle value strategy on futures, entering long when a 5-minute candle breaks the first 15-minute value-area high, with stops below the value-area low around 695. He uses Bookmap to read order flow, watching for failed auctions and rising cumulative volume delta to confirm buyer dominance.
Chapters
All right, so we are here around 9:58 AM Eastern. Market's been up for about 30 minutes. I want to go over a quick little bit of context here and why I'm looking for longs. I'm trying to see if we get a first candle value setup. Now the reason for this is if we take a look at the profiles of the last couple cash sessions, it's pretty easy to see that the market is rotating value upwards. Now what does that mean? Well, that means that the market is moving to higher prices and people are happily trading at those prices. So that means it's getting accepted and we expect this same pattern to continue because if we see value moving to the upside, people are willing to establish new fair value in the market, meaning they're trading volume at these areas. Well, then we know the market is bullish. So you don't want to try to get in front of a stampede, especially with the market that's been this strong. So I see two scenarios. Either we get this nice breakout here, which I think we're going to get here, and we start to pop up here, at least run to this high, or we would retrace down here and I would look for a long there. But looking over here at Bookmap now to get a better execution, as we can see, the market made a nice move down towards that first candle's value area low here. A lot of sellers were trapped in this move, and now we saw buyers attempt to push the market out of this range. Seems like they're holding. A lot more of these sellers are getting into the market, and we're not really seeing too much movement to the downside. So it looks like we do have some passive buyers trying to absorb these guys. I want to see just a little bit more here before I get into a long, but I am leaning in that direction for sure. Now, to be specific on what I want to see, either I want to get this 5-minute candle closure pretty much where it's at, so we could get that long and just a stop loss under the 700 area, um, and then I would look to hold that indefinitely. So I'm going to go ahead I'm going to put this at 695 just to give a couple more ticks. I'm going to go ahead and enter this trade. I'm going to leave an open TP here just in case we go into price discovery. If you guys know how I trade, you guys know I don't really like to take full profits. I just have areas where I look to be more aggressive managing my risk. So, um, that being said, we are now in the trade. And just to go back over why I'm taking it again, we had the first 15-minute volume profile marked out and then we saw a nice closure outside of this area. Let me go ahead and mark or turn off the cash session one so it's not confusing you. We had a nice closure outside this area with this candle that we just executed on. So very mechanical. We're just marking the first 15 minutes, waiting for a closure above the value area high. And this shows us that where the market has established fair value for that first 15 minutes, buyers are now taking it higher and sellers are not able to absorb them. Meaning that the market is likely going to expand in the same direction. So that's the overall basis for the trade. Um, we got a nice little bit of a move here. Now another thing that made me want to get in this trade is the overall order flow we're seeing here on Bookmap. So as you can see, we had sellers attempt to push down outside of the range, and they— that resulted in a failed auction. We had some absorption. A lot of passive buyers were willing to step in here and then they ended up pushing the market up. More aggressive buyers came in. We saw aggressive sellers come in, but they could not push the market back down, so they failed. Now we start to see the market moving to the upside, and we want to watch to see how is the market responding to this nice up move. Do we want to— we want to see these buyers aggressively continuously push through any areas of passive sellers. So we've now seen them hit into this area where there was a lot of passive liquidity. Now what I mean by passive liquidity and what you see these heat maps is just limit orders. So there's a lot of limit sells up here. Now we don't know whether or not the market is going to con— or continue until we can see buyers continuously pushing through these areas of passive liquidity, because we want to see these guys get absorbed like we see right here— or not absorbed, we want to see aggressive traders hit into these limit orders, and then we want to see these guys not reload and the market not dip down too hard. So like, for example, we look right here and we see there was a lot of passive sellers here. Aggressive buyers were happily buying from these passive sellers, happily buying from them. We want to see that continue and those passive sellers leave the market, because you got to think of it like those are the guys that are in the way of our trade, right? Those are the guys that are on the opposite side of the market and we don't want to see them win. And it's okay to see a little bit of like downwards movement. That's fine. It's kind of expected, but it's more so what happens after that downwards movement. Because once we see downwards movement like this, we actually— I like to see this because then it gives me a new place to trail my stop if I am right. Now, if I'm wrong, it is what it is, right? But if we see this little bit of downwards movement and then aggression to the upside, that gives me more confidence in the trade because we're starting to see bullish structure being put in and it gives me a new place to trail out my stop loss. So with that being said, at times like this, I kind of like to just let the market do its thing until we put in at least that second low with a nice aggressive move and seeing if price can start to get into price discovery, meaning can price really get some legs under it? Because overall, so far so good. Another thing I'm paying attention to here is this 5-day composite profile. So this is just the last 5 days of trading, and as you can see, it's very low volume above. We only have traded up here in the last 5 days, pre-market today. So with that being said, if we can start to see aggressive buyers take control and they maintain control, this should be a pretty easy move for us up towards at least this high. And once we get into that high, that is where I'm going to look to trail up my stops a little bit more aggressively. I might trail them up before then, sure, but I'm going to be much more aggressive once we get here because I look at that like I've hit my target, and instead of just taking profit, I'll just trail my stops up to then allow me to see if we can get a nice pop further to the upside. So we'll just let this thing play out and see how it unfolds. Right now I'm not really interested in moving stops up just yet, but it is getting closer to that point. Because now we're starting to get back to this new high. I want to see us push through this and see aggressive buyers continue with this stampede to the upside. Now, if we get that, then I would look to start to move my stops up at least down to here around the 730 area right there at that new swing point we've made. Because I look at it like now we've put in more bullish structure. And whenever you understand the market like this, you just operate a lot differently. You have a lot more conviction in what you're doing. You're a lot more calm, more clear on what you're looking for. And I know that some of this stuff can seem overwhelming, but it's not. It's really not. Uh, it's just something that it takes a little bit of time and to understand. It can be simplified, which is what I'm trying to do for you guys. Um, yeah, hopefully this video ends up doing that for you. So right here we're starting to see buyers attempt to make a new high out of this little micro range we formed here. So we look at this like the The market is auctioning. Think of an auctioneer and he's like, we got $26,700, we got $26,750, et cetera, et cetera. Or yeah, $26,760, $26,770. And it's basically, is a new buyer raising their hand and saying, yes, yes, I'm aggressively willing to bid, right? You have to think of it like that, right? So as we can see, that is happening here. We're starting to make another move to the upside. Now let's see where we want to— let me go ahead and upload the free community. If you guys want to join the free community as well, I'll leave a link in the description. But I did post this up, this plan here this morning. As you can see, watch for this. Moves moving. See, I care about my community so much I don't move my stops first. 2, 7, 30. Boom. So right here at this time, I am going to move my stops up just under my entry. So right at that 7:30 area, move it one tick above, that's fine. So now you can see how fast we're able to remove risk on this trade. Now to go back over why I removed risk this fast is because we did get this nice leg up. I don't really want to see us come back all the way down here. And even if we do, then I can just hop in the trade again so long as it's actually a winning trade. But there's no reason on me keeping risk in this trade past that point because again, I'm getting in this trade based on momentum. I want to see momentum. If I don't see momentum, then the reason I got into the trade is not valid. It's pretty simple. So once we start to put in that new structure confirmed with volume, especially as we're getting into some of these areas up here, then that is where I look to start to, you know, be a little bit more aggressive with my risk. Now, if this happens again and we start to see these sellers that are starting to push the market down here get overwhelmed by buyers, which it looks pretty nice right now, then I would then move my stop up again. So another little gem here that you want to see as we move towards this sell wall, we'll call it, right? A wall of ass. You can see there's quite a bit of passive sellers sitting up here at this high. Now, what we want to see leading into this is increasing volume and increasing CVD. So What is CVD? This number is just the difference between market buyers and market sellers in the market since the beginning of the session that is marked for whatever you are measuring CVD based on. You could do this for the daily candle, you could do this for any series of data you want, but it's essentially just the difference between the sellers and buyers at the market level. So what we want to see— well, ironically, we don't necessarily want to see what we just saw. You saw a lot of passive sellers come into the market. And then CVD rise with those passive sellers right now. This isn't some reason to just hop out of the trade, but what I was going to tell you, what you want to see is continuously increasing CVD as we approach passive areas. So if you start to see the CVD continuously approach, we see volume increase. Then look at it like this. There's a 300-pound guy holding a door shut right here. The buyers are a bunch of really little guys. Think of it like that. And they have to get a lot of speed and momentum to smash through this level if we want to see a continuation. So if you don't see CVD increasing as we get up towards these levels and you see the market kind of halt and pause, think of it like this guy is going to have a really easy time just holding that door shut. But if there's 100 little guys running as fast as they can, they could be 5 foot tall, 110 pounds. If they're all running as fast as they can and just slam into that thing, you're going to see some kind of reaction through it. So that's kind of what we want to see here. Not— and to be clear, I'm not saying I think that's going to happen. I'm more saying I'm going to react to whether that happens or not. So when you shift a little bit from trying to predict as much, from reacting, like for me, I mapped out the area of the first candle's value. It's very simple. I literally just map out this tool, drag it over here, and then I wait for a candle closure above this area. Once that, I start to look a little bit more in-depth and get a little bit more aggressive and, you know, precise trade management. But it's really simple. I'm just reacting to that candle closure. Then I'm watching here and I'm reacting to what the market's doing. Notice how I'm not trying to tell you the market's going to go exactly to this price or at this time the market is going to— no, I'm not doing any of that because that is bad for your psychology, because now you're placing unrealistic expectations that you're a fucking fortune teller and none of us are. No matter how good at trading you are, you're not going to be able to predict every last, you know, future movement. And that's not what we're in the business of doing. We're in the business of making money. Which means we just need to be able to interpret what data the market is giving us and make decisions based on that. Not what data we think the market may give us. That doesn't matter, right? We wait until it does give us data and then we act on that. And this actually shifts the mentality of trading into a much less stressful one because now it's not your job to see the future. You know, a lot of people get into this business and they're so stressed out because they think it's a lot more difficult than it is. But in reality, they're making it difficult on themselves or a lot of these trading mentors have made it more difficult because of the dreams that get sold, that you're going to be able to spot all this crazy stuff and foresee the future. But we don't, we don't try to do that as traders. And not to rant on this too long, guys, but it's something that I used to deal with a lot that made me lose a lot of money. And just trading was very frustrating for me until I started to really look at trading the right way. So as you can see right here, we zoom out. CVD is rising. I'd like to see sharper rises. So as we're heading into this area now, I'm going to go ahead and give an alert to the Discord here. Watch this passive. So what I like to do in moments like this is I'm now going to look and say, okay, cool, look, where did this tipping point really happen? Right in the $7.59. I see a lot of volume around here, a lot of volume right here. So I'm going to go ahead and move stops to $7 50 right here, and I'm going to go ahead and notify them. Cool. We'll go ahead and post this up for— I'm trying to appease you guys and the free community. Um, hopefully this is helpful, but again, if you want to join, there's a link in the description, totally free. And I try to post a lot of this stuff because I understand like as you're going through the market, when it's open, that's when you're actually going to learn. Like you can watch YouTube videos and I mean, I guess this is probably going to end up on YouTube, but it's different when you're watching like this classroom video. Like, yeah, those go viral and get, you know, retention optimized and it's very structured and I get it. That helps too. Like you do need that, but that's going to only get you so far. So that's why I want to make content like this and I really don't care if it gets views or not. Because this is what's going to actually like really teach you the nitty-gritty of trading. So we got tagged out on that one. I'm going to go ahead and alert them for a win. Tagged out for a dub, watching for possible reentry. So now what we want to see here, or what I want to see, is kind of like if the market does retrace back down into— see this over here? There's a higher volume node here and it's kind of coinciding with this value area high. I'm not saying I think the market will retrace there. If it were to retrace, I would watch that area. Now, the other setup I would watch is whatever range we form after hitting this area right here. How does the market react in this after the smoke clears is what I like to call it, right? Because we've seen a pretty big sell-off. A lot of market sellers are getting in the market. And when I say market sellers, I mean they're using market orders. But I want to see, do these guys get absorbed, right? Because if we see these guys get absorbed and buyers just want to push the market higher, we now see that all these passive sellers, these guys aren't in the market anymore. So we want to see, do buyers have that ability to push price higher? Do buyers have that momentum? And is there an imbalance between them to push price past the area where all these passive sellers entered the market? Or do these passive sellers reload, meaning you see these heat maps kind of pop back up and they set more limits? or do you see these aggressive traders get into the market on the selling side? Now, I'm not really interested in selling today just because the overall momentum of the market. Now, another useful tool you can use here on Bookmap, it's called— I call it SDP. So it's just the sell session delta profile. So this is areas where we saw a large concentration of one-sided aggression, meaning right here at this area you see over here to the right. This means that there was a lot of positive delta at this 26700 or 26760 area that we're at right now. Meaning a lot of aggressive buyers are or were positioned at this level. And you can use this as a barometer to how in control buyers are of the market, or if those buyers are still present, because the market will try to stay above that. Now, if you start to lose these levels, you will start to be able to sell. Okay, well, a lot of these aggressive traders are now trapped if they're still in the market, or they're just out of the market. Either one is the same outcome, which is that you could start to see an imbalance shift towards the selling side. But if we hold these levels and we see the buyers step back in, we could say that, okay, cool, we've got a— we've still got a dog in this race. And then look to see if we can continue that direction and see if we can catch another move on it. I'm liking this overall. I like having stops right around this area. If we can get a nice pop, I want to see a little bit more. I want to see us either test this area again right here and start to pop back up to the upside or get a really nice pop through this area. If I don't see something soon, I'll probably just call it. But I'd love to see a failed auction at like this microstructure level right here. And what I mean by that is you see how they were starting to form this mini range. I would love to see sellers intensely try to push the market out of this range but fail, because I look at that like those, those guys are going to get trapped. That's fuel for my trade. You always should be thinking like, who is wrong? What participant is wrong for you to make money? Because somebody needs to be. The other side of the market needs to be very wrong if you want to see an explosive move. So, and when I say wrong, I mean if they're aggressively selling, and you can see that here by a lot of volume, then you want to see— and it's not really a lot of volume right now, but I'm just saying increasing volume relative to what the benchmark that this range has is. If you start to see aggressive selling without any reward, meaning price isn't moving down, well, you could say those sellers aren't in control of the market because if they're in control of the market, the market would move down. So hopefully that's helpful. And if that doesn't happen, if we start to move down here and we don't see those field auctions, then that's where I start to say, okay, cool, I'm probably not as interested in this, this trade as much. So we'll give this a second, see how it unfolds, see if we can catch another trade here. Again, notice how the market's kind of forming this little micro range. We're starting to form fair value even on a microscopic level. If the market pauses and consolidates, then we're finding fair value. So there's balance right here within this price range. There's an equal amount of buyers and sellers— or not even equal amount, but there's an equal balance between buyers and sellers, I should say, um, in this area. And we want to see an imbalance in order to get in the market. We don't want to trade chop. I want to trade imbalances. I want to trade when the market is severely one-sided, and I want to be on that one side. So you have to wait and be patient for those things to occur. We're now starting to see negative Delta at this level. So notice how that 760 area has started to add a lot more negative Delta, and we can see it here as well. So we see a lot of aggressive market sellers getting in the market here. However, we don't have a big move to the downside yet. Now again, we're not trying to predict, but if we we were to get nice upside and there are a lot of aggressive sellers, that is going to act like rocket fuel for this trade because all of those trades are going to be underwater. Now maybe they win, maybe they pop us out right here and it just tanks. I could care less. I've already made some money on the day and I'm not going to chase that move. But I'm, again, I'm reacting. Like if we start to see all these sellers here and they, they fail and the market makes a move to the upside, then that's going to be a great opportunity. If it doesn't, then I'll probably just sit it out. And it looks like it's not going to right now. So we see that increase in volume here. Now, unless buyers start to defend here and we start to range and start to bounce off the bottom of that range, then I'll probably just call it for the day. And it's not a huge day. Like, I made like $3,000, which, I mean, to be fair, that amount of money would have been life-changing to me just a couple of years ago. So I'm still grateful for it. I never write it off like it's nothing, but, you know, it's not one of my biggest days relative to my recent trading, and that's okay with me. If I end up hopping out of this market and that's what I make, I'm going to go on and have a great day and hopefully post this video to YouTube up for you guys today and let you guys learn from it. Or what's even better is the market starts rallying and we catch another long and can absolutely bang out an insane day. But you never can hope for that. You never, never can plan on that, so to speak. You only react to it. So it doesn't look like any buyers are stepping in to kind of prop this market up yet. A lot of sellers are stepping. As you can see, since we head up into this area, we see a lot of aggressive sellers in the market, right? A lot. So that doesn't necessarily mean I don't want to trade. Like I said before, if we do get bullish, uh, price action here, I would want to trade more because I look at it like all these guys are going to get absolutely demolished. Now if we don't though, then I would say, okay, cool, then, you know, these guys are taking control. They're likely at that point I mean, just for learning experience, again, likely to take it down where? To areas where there are high volume. But the more we trade up and develop volume like you see here, the more bullish I get. Now, you can see this a little bit better by looking at the cash session profile. So when I'm looking at this cash session profile, what I want to see is us exactly what we have here, pop out of a value area high and develop volume, meaning we see extra volume traded. That's showing that there's a lot of people trading at these new higher prices. Think of it like the auctioneer. And if we stay up there and price stays up there and starts to give me bullish scenarios, then I would look to long from there. Obviously, that's not happening right now. We did actually just now tap down into this area I was just talking about. But again, this is just for trying to teach you guys how to look at this stuff. And then once you understand, like, okay, well, if this happens, then I do this. If that happens, then I do this. You don't have a lot of these mental, like, psychological problems that people think they have. A lot of people just don't have a system. Or their system is very limited and rigid and they don't really understand why it even works, so they don't have enough conviction to stick with it. So hopefully this kind of stuff is helpful. Now, this is where I really want to see soon if we're going to be bullish. I'm not saying I think it's going to happen. I actually would say I think it's not going to happen. There's no reason to think it would happen yet. But if I was going to long again today, I would want to see some kind of aggression to the upside soon, or I'll just call this day and be done with it. So we'll see how this unfolds. Just kind of give this thing some time because notice we had a lot of selling right here. Huge, huge increase. There's not really a tremendous amount of reason for me to look for longs other than the overall, you know, kind of flavor of the market here. We've had a bullish momentum to the upside overall. The market's been extremely bullish, um, in general. We're above the current week's value area high. So this profile you see over here is the week. So we're above this week's value area high, and we're starting to trade a lot of volume up here, which shows acceptance, meaning again that auctioneer is calling some higher price and the market is accepting it. And then over the last 5 days, the same thing, we're trading much outside of the value area high, which is where we go to gray. So the market's trading above premium pricing and not seeing any huge reversals. So that can tell you the market is bullish. So don't get faked out, you know, so easily on some of these down moves. So just looking at this, I like this reaction to this value area high so far. Now what I want to see is more aggression and a lot of momentum building in that direction in order for me to get into a trade. So not much making me want to get long on this day so far. So on that note, I'm going to watch for maybe another 5 minutes. 5 to 10, and then I'll probably hop off here. Not necessarily because I think there just won't be another trade, but because I already made some money. I do have other things to do today. And typically I've noticed myself, once I outline exactly what I want, and on this day I want to see momentum, if I don't see that soon, it's not that I don't think the market's going to go up, it's just that I'm not as interested in risking in that market. Very important distinction for you to clarify as a trader for is what determines when you can look at a market and say, oh, okay, well, I think it's going to do X, Y, Z. Versus what makes you look at a market and say, I want to risk my hard-earned money on that market. What is the difference for you? One is analysis, one is execution. And this is where most traders lose because they don't understand the difference between the two. They think that you can just plot out what direction the market's going to move and make money from it. That's why you see people on Twitter and social media just posting these line charts of predictions, but that doesn't pay you. Being able to make money is understanding exactly exactly what it takes to get in a trade, exactly what it takes to pick a side of the market, exactly what it takes for you to even entertain the idea of risking money. If you don't have that and it's not clear to you and very simple, 3 to 4 or 5 things, then you don't have a system. For me, it's really simple. I just want to see how the market was reacting to a key level. Now I have a set of key levels that's going to be the volume profile levels and the first 15-minute volume profile level. So volume profile, for me, I'm marking on the RTH, meaning the cash session since 9:30, the last 5 days, and the current weeks of price action. That's it, right? That's— there's going to be value area high and low for each of those levels. Past that, I'm just watching how the market behaves at those levels. Are we seeing imbalances of buyers or sellers at those levels? Once I can confirm that, I'm looking to take a trade. It's really that simple. I'll also take a look at the value areas over the last couple cash sessions to see which way is— are we trending. And notice how there's so much noise with market structure, right? There's so much noise all over the place, back and forth and back and forth. And it goes from bullish to bearish so many times. But when you look at the value, it tells you everything. We can see that value moved higher. What happened the next day? We opened higher than the previous day's value area high. So that's saying the market is now opening. It's starting at a higher price than everybody said was fair yesterday. And then what happens? It goes higher. People are raising their hand as that auctioneer is saying $26,500, $26,510, $26,520. Everybody's just rushing to try to buy. It's a bullish market. And once you understand how to look at it like this, you have a lot more conviction in what you're doing. You'll sit out of a lot of bad trades and a lot of chop because you know exactly what it is you're looking for. And if you get that, you execute. If you win, you're happy. If you lose, you're happy because you stuck to a plan. So Hopefully these, uh, these rants are good for you guys and drill some fucking logic into your guys' heads sooner than I was able to learn it. Because when I started, took me a very, very long time to be able to grasp onto some of this stuff. So as we can see here, and this is kind of another thing you can watch for, notice how there's just so many sellers getting into this market. We're not really seeing much of a move to the downside though. Not yet, at least. Yeah, we have seen a little bit from the highs for sure. We've moved down about 40 points, nothing crazy, but we've seen a drastic change in the amount of market sellers in this market. So again, like, the only reason I've been still watching here is because we haven't really like shifted too much, because if you look, where are we at relative to price action? We're literally still trading outside that first 15-minute value area high, right? This first profile over here that we marked and used to enter the trade. So based on that, like, we're literally just retesting that value area high and coming back down to where there was originally an imbalance of buyers. So are these buyers still present in the market, um, and are they going to be able to overwhelm these sellers? That's the way you want to think, um, whenever you're looking at these kinds of moves. A lot of market sellers here. What we're looking for is some nice pop, some nice real like buyers taking control of this market, a nice increase at the market level after that. Now we're starting to see bracketing where we start to go a little bit more in depth, and you can see where the passive traders are sitting. We've got a lot of passive traders sitting down here on this 26,720. As the markets came down to that level, notice how right here there was a passive buyer here, right? The market aggressively tried to sell through it, was absorbed. The market's coming back down and look who's here. A passive buyer is waiting there. So this is what you want to be watching for. Like, is this person going to be able to prop this market up? Maybe they've already absorbed all these guys, but somebody is willing to keep buying. But as long as there's a large market participant that has bags willing to just drop on more buys, it's going to take more and more aggressive sellers to try to push through that area. And until you see that, you can assume that at some point those sellers are going to get absorbed because the overall market has been bullish, right? So we also want to look over here. We see a huge volume spike. You can go in a little bit more in depth here and really see where that was. The volume spike was right here around that 7:30 area. Ironically, um, right where my stop was. Um, this is after I think we got stopped out the first time. But anyways, that was— no, that was the original stop. That was my entry. That's right. See, I actually— I'm glad I moved my stops up because I would have gotten stopped at entry. So side note, we see where a lot of this volume really was. The majority of it right here was around that 7:30 area. So if I'm going to get into a trade, my stop's likely going to be around there because I don't want to see those traders, um, kind of take back control. I want to see these guys trapped. Now what I want to see in order to get in the trade, which I'm starting to see more and more of, is building momentum to the upside and these sellers, um, being trapped. Because we can also look— I know it looks like a lot on these screens. Another thing to pay attention is how fast the, the tape is moving, right? Watch, notice how when this starts to move really aggressively, really quick, usually a big move's about to happen, right? Because there's a— it's just getting a lot of activity. There's a lot of, a lot of, uh, orders exchanging hands. So you want to watch how this accelerates as you're approaching the key levels and then watch the result of that. So here we're starting to see now an increase of these aggressive buyers here. So I'm going to go ahead, I'm going to get in another long, and I'm going to look to risk $5,000. I'm going to go right at like $720 8. Tight stops. I'm going to leave an open TP. If I end up walking out of here on a loss, that's fine. I'm happy to take a little bit because I already— I'm up about $3K. I'm risking $5K. Let me go ahead and post that to these guys as well. So now we're starting to get a little bit of a nice pop here overall. Again, same thing we've been talking about, right? I talked about why I wanted to enter this trade if we started to get that failed auction of the downside through this range, which we got. I would still say we're still building— I'm building more confidence in this. I'm not like, you know, gun to my head think it's going to for sure work because we still have quite a bit of these sellers to overcome here. But it's looking good so far. We saw those sellers originally push down from up here and then we started to form that range. If we zoom out even a little bit more, we saw this failed auction to the downside. These sellers really tried to push the market down. Some kind of a passive buyer stepped in and said, hey, I'll take all of the— all of this stuff you're trying to sell, I'll take it and more. So the market's making another move higher and we expect for this to happen because the overall flavor of the market's been bullish. So now we want to see, do we actually pass back up through this high of day? Not this time. So 7:30, our entry is at 7:50. Looking to see if I can get a nice trail here. There really a reason to— yeah, honestly, I'm going to go ahead and move stops up to $7.50 and go ahead and alert. Now the reason I'm doing that, I'll go ahead and give you a— to $7.50. Boom. Um, the reason I'm doing that is because we see this nice move to the upside and then we're approaching the high of day where we saw these passive sellers step in earlier. So they might end up getting back in. This is the first problem area for this trade. When I look over here and I say, where are the aggressive traders most recently positioned? We see a lot of this aggression on the buying side, which is what we're— side we're on around the $7.50 area. Right. So a little bit of this is me wanting to move my stops to entry pretty quick just based on the day. I want to secure my risk because I think that if, if we start to see a hit back up into this and another retracement, that's not a day I want to be involved in. But as you can see, we're starting to see a nice move here. Typically though, I want to see this raise in CVD happen beforehand. So I'm going to go ahead and I'm going to move my stops up to 765 and alert the group. So now we're floating about $7,500. Um, I'll just kind of move this up in case we get some big, big momentum. So now we can see what we wanted to see earlier, that price discovery. But now as we hit into this area right here, we're at that $800, so big round number. So typically around these times, I'm going to go ahead and I'm going to move it to 770 right here and move it for them. Now we're up about $6,700 in this trade. Let's see if we can get something here, guys. We've been patient. You have to keep maintaining that consistency. As you can see, there's nothing bad about taking a small little, little win right there. Nothing wrong with that. Even though we didn't hold on this whole time, we can enter. And once you understand what you're actually looking at, that becomes a lot easier. So now I'm looking over here at $775 area. I'm looking at that just because this previous high was right there. Got our stops right now at that 770, pretty much 660 or 769 and a tick or 3 ticks. So we get stopped out here, end up walking out of the day on about $6,500. As you can see, we did get stopped out and that's fine. So let's see what we're at total in the day. 40— no, 4,800. So actually a little bit less. I guess I got slipped on that first trade. So on that note, I'm probably going to actually walk out because, you know, $4,800 in about an hour isn't too bad to me. Um, actually, I'll go ahead and show live too because there's a lot of clowns out on internet that don't actually even trade. Side note. Um, anyways, I think transparency is always really important, so I always like to share this stuff. So, um, good day overall. I'm gonna call it on that one. I like the gains I've got. Not trying to sit here and overextend and get greedy. Hopefully this was a helpful video to you guys. And make sure to subscribe to the channel. If you want to learn more about this stuff or trade with me live, I have the mentorship where you can actually sit with me while I'm trading. And there's trading streams 5 days a week— London, New York. And also we review every single trade you take, teach you the full system. You get access to the community, you get access to Smart Trader AI, a bunch of other stuff. And if you qualify, because everybody doesn't or not everybody does, then you— I guarantee that you will become a funded trader in 12 weeks, or we will personally trade with you until you are. So thanks for watching the video, guys, and I'll see you guys in the next one. Peace.










