
The Best Volume Profile Trading Strategy (That Actually Works)
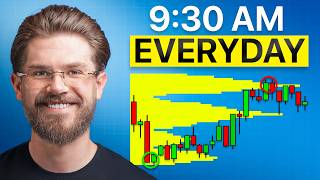
Jesse Rogers breaks down the Vacuum Method, a three-step volume-profile trading system that uses price shapes and low-volume nodes to catch fast moves in ES futures. The strategy identifies when smart money is trapped, enters at the point of control, and targets the low-volume vacuum with tight stops.
Chapters
So this volume profile strategy recently helped me turn $9,000 into over $170,000 in less than 90 days. It's called the Vacuum Method. And where most volume profile strategies only give you levels and theory, this gives you a clear process to execute. Clear entry, clear stop, clear target. Let's get right into step number 1. All right, guys, just for transparency, I want to show you guys logging in to my live regulated account. As you can see here, we are on trader.tradovate.com, which is a regulated broker. Go ahead and log in, and once it loads, we'll head over here to live trading, and then we will go and take a look at my performance. So we'll go to the reports, and we will go back to whenever I started this account, which was back in November, and that was on the 5th, to today. As you can see, we have ran this account up to $173,000. Total gross profit, $168,000. Took a little bit of losses this week, but I always want to show you this because transparency is important. And if you're watching videos from somebody teaching a strategy, you should understand that they're actually profitable. But I want to be clear that these results are not typical. I've been doing this for 10 years and I'm not guaranteeing you're going to get the result. Now that we got that out of the way, let's hop right into the video. I call this strategy the vacuum model because once you are in a trade, price moves rapidly fast as if it was getting sucked through a vacuum. Now for this strategy, it's really simple. There are only 3 steps and I'm going to break down all 3 steps. I'm going to break down some basics of the volume profile and then we're going to hop on a chart to go over some live executions. First, let's go over the volume profile basics. So the volume profile just shows volume at price. Okay, so normal volume is just going to be where you have a chart and then at the bottom you have little volume bars and this just shows you volume by time. but that's not as useful because we want to see where the large market participants are trading. So if your volume profile looks something like this, most likely price moved up. You saw a little bit of consolidation. And what this can tell us with the volume profile is that where the market established a fair value. Now that's what we're going to call the value area. Okay, so value area high is VAH, value area low is VAL. And what this shows you is where 70% of all volume was traded. So if we can determine where the most volume was traded and we have a range for that, we can determine where smart money is being positioned and how the market is reacting to these positions. And this can help us know who is in control of the market based on data, because we want to make sure we're trading with the smart money and avoiding getting trapped, because that is the number one killer of retail traders, is getting trapped in fake moves. Now a couple different things you need to understand, or terms you should know. The point of control, which is just the area where the most volume was traded. So this is going to be the level in price where the most volume is traded, and this is going to be important later in the video, so remember that. An HVN is going to be a high volume node, so an area where there's a lot of volume, and this is going to be an area that you're going to want to pay attention to as well. And for this strategy, the most important part is the low volume node. Now, low volume nodes means that the market moved really quickly through these areas. Typically, this is where you're going to have your fair value gaps, and it's just showing you that the market was in a state of imbalance. So we have balance, which is the consolidation usually found in a value area, and then imbalance, which is where we have low volume nodes. So not a lot of traders were positioned here. And if the market gets into these areas, it's likely going to get sucked through it like a vacuum. And then you've got your value area high and your value area low. So the value area high shows the high area of where the market had established fair value. And if you see the market pop out above it, if the market's going to be bullish, you want to see it, you know, retest it and stay above it because that would be the market saying, hey, you know, here was the fair value, but now we broke above the value area high and we're accepting new highs. That's the definition of what's going to make a market move higher, is that if the market doesn't have enough sellers to sell off from from premium. So you want to think of the value area high, and you see buyers stepping in willing to buy for a higher price. But if you don't see that and the market just falls back into the range, likely you're going to go down and see the low. And then based on your reaction to this, that's going to be able to tell you whether buyers are stepping in to buy these lower prices or if sellers are stronger, and that's where you'll get these big moves. Now, the point of control is also going to be very important in this strategy, and that's just going to be that area again where the most volume was traded. Now that you understand the basics, let's get into step number 1. Which is spotting the shape. Now, our goal here is to identify a P or a B shape profile matching trap scenarios, and we'll get over to those scenarios in step number 2. But first and foremost, why are shapes important? Well, a P shape is pretty much just that. Okay, we have a P looking profile, and what this shows us is that we saw imbalance to the upside and then we saw the market consolidate and kind of accept these higher prices. Now, typically you're going to look at this as bullish, right? Because we saw a big move up. And then the market got accepted there and no one sold it off quickly. However, there are some scenarios where this is a huge trap and we're likely going to get a big move down. Now, why would we expect a big move down? Well, if a P-shape profile fails, we can say that this low volume area is very, very low in terms of resistance. Okay. So if we move into these, you know, lower volume areas and the market continues to move, it's likely going to move very quick. Hence the name, the vacuum model. And that's one of my favorite things about this strategy is how fast winning trades move. And then when we have B-shaped profiles, they're shaped like a lowercase b, and what this shows typically is a bearish move down, and then we'll see some kind of consolidation. Now again, this is widely accepted as bearish, and oftentimes they are, but when you know how to look for the traps, you can capitalize on those fakeouts. And fakeouts are always going to be those explosive moves because again, we're going to be trading them through areas of imbalance, and those areas of imbalance are are why we get those fast moves. Now let's get into step number 2, which is reading the cause of the profile, because the reason why that profile shape formed is very important. Was it formed by people entering? And when we say people entering, I mean smart money. Or was it formed by smart money exiting? Now this is where we're likely going to get traps, because if we get a big move that was just caused by, let's say, a bunch of whales sold and the market moved down and they end up covering that short, that's going to count as a buy to the market. And then if the market moves to the upside here, a lot of retail traders are going to do what? They're going to jump in because they think the market's bullish. But then whenever this smart money position is still active, they want to still push the market down more. And this was a fake move. And then you're likely going to get those expansive moves. So this is what we want to capitalize on here. But the key is understanding when this is likely to happen. Now, what we just explained right here is what we call a defensive move. Now, a defensive move again is when smart money is just covering or getting out of their trades, and those moves are likely to fail. Okay, so anytime you see this P-shaped profile like this, which this on a volume profile probably looks something like this, you had this very little bit of volume here, pretty much no real money getting in the market, and then a lot of volume up here, which gives you that P-shaped profile. When you get that and you have very little volume here after a big down move, that is likely just smart money exiting their trades. And this is loading up a trap. Now, in a real move, which are— these are the ones that you're expecting to continue, you're going to see multiple distributions building in a trend. So let's just say you had the same kind of setup. You had this big consolidation where smart money got positioned and a very big down move like you see right here. And then you had a really big move up and a consolidation. Very similar setup, but let's just say in this setup, if you looked at the volume profile, what you saw wasn't just this super low volume node, but instead you saw a lot of these higher volume nodes throughout, and then you still saw that P-shaped profile. Well, this is going to show you that there were large amounts of volume getting into the market on the way up, and this shows smart money is entering new positions, and these kind of volume profiles are likely to continue. And that's a real bullish profile because it's offensive. So you're asking yourself always, what is smart money doing right now? Are they on offense or are they on defense? That's what you should be asking yourself whenever you're matching these profiles. Now, let's take a look at some examples because I know that this can sound good in theory, but you want to see it on a chart. There are 3 main scenarios because the scenario is important and understanding the why behind this is what's going to separate you from the average trader who's just blindly trading patterns with no conviction from a trader who knows what they're doing and trades with confidence. Okay. And that's very important for how you trade. It's going to affect the way you manage your positions and everything else you do. So when we talk about these 3 scenarios, let's go into scenario number 1, which is end of day covering. Now, when I say covering, this just means that smart money is exiting their trades. Okay. They're not entering new trades, they're exiting. So let's just say you have price trending in a downwards move all session. Okay, then shorts take profit at some support level and you get a fast burst to the upside. This is the beginning of a trap very often. So the way you're going to be able to trade this is by looking at the next morning. Now let's take a look at this. So if we look right here, this is ES on February 11th, in case you want to go and take a look for yourself. We have this down move which created a B-shaped profile. Okay, in this down move, when this happened, we see that this day— so notice the times here, this is noon. So right here, this was an end of day move. And if you look at the overall day, the overall day was pretty bullish, right, for the most part. And then we saw this huge sell-off at the end of the day. So at the end of the day, this shows that smart money had covered on those longs. So that caused a really big move to the downside. And then if you came in to the next day, which was right here, so pay attention to the times. So this is at 9 AM the next day. Then right here you can see that the market started to show signs that we're going to move to the upside. And this is where you'll get these very aggressive moves. Now I'm going to show you how to draw the volume profile. I'm going to show you the exact entry rules. So you have a mechanical way to enter trades. But for now, I want you to understand the concept of these fakeouts. Now let's look at another example on February 11th on ES. We had this really big move to the upside. And notice there are a little bit of volume right here, but these aren't high volume compared to what you see here. Okay. The majority of trading was happening up here in this range. Now, another trick you can use is you want this consolidation to be narrow. Okay. You want this whole little move to be pretty narrow relative to the whole move. So pay attention to the times. This was right at the end of the market and this day had been moving to the downside. I just didn't include it in this example, but it had been moving to the downside. And as you see, we have a huge move to the upside. So when we come to the market the next day, this example is kind of unique because the market had already sold off and went through that vacuum. However, you can still use this logic to say that a lot of these traders are trapped. And if we see the market making another fake profile, as you can see right here, we had a fake P-shape, right? And you can see right here there was another fake P-shape right here. And we'll go over this in the examples. This also provides an entry where you can take the same trade again right through this low volume area. And oftentimes these setups happen very early in the day because the smart money is getting back active in the markets with the regular trading hours at 9:30, and that's where you'll see those aggressive moves. Now let's talk about scenario number 2, which this is where a lot of traders get cooked. And this is going to be based on news or events. And one of these just happened with the fake little Iran ceasefire that Trump announced. So this could also happen with FOMC, CPI, you name it. Any big news event where price will make a huge move. And a lot of this is not what you want to be trading. So what you want to look for in these specifically is volume in a tight range at the top and then the next session fail to actually build any value there. So let's take an example at what I mean. So look right here, we had this big pop to the upside, right? Huge, huge pop. And this was from March 23rd to the 26th. This is that Iran move I was just talking about. So you have a huge P-shaped profile with little to no volume on this up move. Now, as you can see, the market ended up fading away from this. We are getting rejected from this area up here, and the market didn't really create any value above the value area high. Now, on this move, notice how high we moved up. We moved all the way up here, and the market didn't make any value towards the top of that move. So we can say that that likely isn't going to continue based on the fact it was from news and because of this right here, we see that it wasn't getting accepted at new prices. There was no real money being traded there. But we can see a lot of consolidation here. And this is all traders getting trapped. And when traders get into the market and they think it's going to be bullish, all of their stop losses are going to be placed all throughout here. And once they are all in the red, the market is going to move like rocket fuel because they're going to be exiting those trades. And when they exit those long trades, that acts as fuel. And then on top of that, you have this free fall. You want to think of it like once you get into this area, the floor is coming out from under you. And you can see that's exactly what happened. The market came into this area and then we had a rapid move to the downside. Now, scenario 3, which is the most common that I see, is the overnight unwind. And basically this is during Globex and it's, it's, you're going to see price pushing very aggressively overnight. And then on the open, you're going to see all this get cleaned up. So we'll look over 2 examples. The first one is going to be March 10th. As you can see right here. So overnight we had this move. You can see that this was before the open. We had this big move moving into pre-market, and then what ends up happening right around this 9:30 area, you see the market start to bottom out. And then as we get this confirmation here, it makes a massive move. And where does it go? Right to the end of the vacuum. And these trades, again, when done correctly, are going to move very quickly and this is something that's good for a lot of traders' psychology. And also it's a very satisfying trade to take. Now let's look at the second example, which was on March 3rd on ES. As we see right here, previously during the Asian and London session, we saw this really big move to the downside. So as you can see right around here at market open, the market made a fake out move down because remember, we're expecting this to be a fake out, right? So anytime we see a scenario where we think that shorts are trapped and we see more downwards move, we're not panicking. We're looking for opportunities. So as you see right here, we had a nice reaction, moved right back above that point of control. And this says a lot because if we're saying right here, this is where the majority of these shorts are positioned and we're seeing that level lost, well, those traders are wrong. And you should always be asking yourself, who is wrong in the setup you're taking? Like, is there another counterparty who's wrong? Because there needs to be if you're going to be right. And the market makes a big expansive move to the upside. And you can see it trades right up here to this value area high, and then it ends up trading up higher to the end of the vacuum. Now let's talk about step number 3 before we hop on the live chart examples, because this is where you're going to pull the trigger. And this is what makes this strategy different than a lot of volume profile strategies, because a lot of them will just have theory, which is kind of like what we went over. But I want to give you guys a mechanical way to actually pull the trigger on these trades. So an A+ entry is really, really simple. Okay? You just have to have one of those scenarios. and then you want to see the point of control fail. Like we just talked about in this example over here that we just went over, we saw the point of control fail. So if we were going to be bearish here, you'd want to see the bears control the market under that point of control. Because if the market's under the point of control where most volume is traded, you could say that if we're rejecting from that, from the upside, that's going to be bearish. But if you're not seeing that in a B-shape profile, that can tell you, along with the fact that we're in a scenario where a trap is likely, that it is a trap. Because if the bears are losing the point of control, think of it like tug of war and they're starting to lose the tug of war. And that's when you see these expansive moves. Now, the way you're going to enter these is you're just going to put your stop right below that point of control, because with that logic, you want to— you wouldn't want to see that level overtaken again. And you're just going to target the end of the low volume node. And we always want to trail our stops to exit trades. This is something that has helped me extremely in my trading, get way more risk to reward and just more out of my winning trades. And we're going to go over this in an example here on a chart. Also, guys, if you ever find yourself trading and you hate trading alone, you just wish you had a mentor sitting there with you calling out trades while he's screen sharing. I do have a live trading room. I'll leave the link down in the description. It'll be right at the top. All right. So now let's look at our first example. As you can see, we had a general downtrend in the day. And then we saw the end of day, those shorts cover and a big move to the upside. So what we would want to do is wait till that next session, which is where you see this purple line is. That's right at 9:30 AM. So if we're waiting till 9:30 AM, we come into the market right here. What we can see is that this is likely a fake out because we had this P-shaped profile and the market sold off through it. And this happened at the end of the day. So we can see that yesterday shorts were in control. They covered, and then a bunch of buyers got trapped and we saw more shorts step in. So that gives us a bearish bias. Now, another cool way you can do this is you can just go here on this 5-minute chart, which is what I'm on right now. And during the session you're on right now, you could go and draw a profile from the bottom of whatever swing leg. And as you can see, we have another fake P-shaped profile. Now, in this example, you would have taken one loss. And I want to be very transparent that no strategy is 100% win rate. And I want to show you guys how to navigate around a loss. So as you can see here, right here on this candle, we closed under that point of control. So what you would have done at that moment is you would have gotten to a short right here and you would have put your stop loss right above that level and your target would have been down here. But as you can see, that trade failed and that's okay. At the end of the day, when you have conviction and why you're doing what you're doing, you're not going to be scared to pull the trigger again. And that's why we have good risk to reward. So the second trade you would have taken would have been after we retested this point of control again and then we closed back under it. So on this second trade, you would have taken right here at that close, same exact setup. You'd have put your stop right at that point of control and then you would have targeted the low down here. Now, this was even better risk-reward. And I share this with you guys not to pick some cherry-picked example and only show wins, but to show you guys you can lose. And still have a great idea and still make a lot of money. Because in that example, you lost 1R. On this one, you made 4R. And that is how trading actually works. It's not always perfect. Now let's look at our next example. As you can see, we had this big move to the downside in the overnight session. So it was before 9:30 and it was after yesterday's close. So it was outside of regular trading hours. So we saw this big move down, okay? And this kind of hangs out around here. And then when the market opens, which was right around here, okay, the market opened right around here. Now we saw a fake out move to the downside. Now there are two ways you could have entered this trade, okay? Number one, and you can treat these levels in this scenario, the value area low or the high, as a key level. And anytime you're getting a confirmation of that key level, you could trade. So there's really actually three ways you could have traded this, but let's go into all three. So since we understand that this is likely a fake out, okay, we had this fake out move, that formed a B-shape profile overnight. And the way I'm drawing these, I'm on ATAS, which is a trading platform that's a lot better than TradingView because it actually shows volume, okay? TradingView doesn't have real volume. It's good for some things, but when using these smaller ranges of price, your volume profiles will not look correct because it's not basing it off real volume data, it's basing it off of tick data. So now for the execution of this trade, as you can see, we're expecting this to be a fakeout. And when we are expecting something to be a fakeout, we're going to be looking for these bullish reactions. So as you can see, we hit into the value area low. And the reason why we're looking at these levels, think about it. Let's say if we think that, okay, here is where we're likely to go. And we know that we have these 3 database levels, the value area high right here, the point of control right here, and that value area low right there. So we could look for any kind of bullish reaction if we're trading down into the low and we reclaim it. or you could trade a breakout of any of these levels above. So right here, notice how we closed outside under the range and then we popped back into the range with a lot of force. So right there you could have gotten to a trade. And on these examples, I like to keep my stops right here at this value area low. Now that gives you a really good risk to reward. You can put stops lower if you like, like when you're learning this, but I personally like my stops being very tight because I don't care to like lose a trade. I'm all about trying to get really big trades, okay? And I'm willing to swing the bat more than once if I need to, just like I talked about in that last example. So right here we can see that we could then target up here and the market moved really aggressively. Now, something else that I do is I don't actually take full profits when I hit into a level. What I do instead is I look at how I can trail my stops. So let's just say we hit into this level up here with this candle. I'm just going to trail my stops up under each candle. So I would have trailed it right under that first candle right here. I trailed up again right to that candle and then right to this candle, and I would have actually gotten tagged out right there. So that doesn't sound like a big deal, but whenever you do this correctly, you're going to be able to increase your average risk reward drastically over time because as you can see, we went from a 6.7, which is already amazing, to a 7.3. Now, that may not sound like a bunch, But in trading, math is your best friend, okay? And if you can add on just a little bit of extra risk reward to each trade on average, that's going to make you insanely more profitable over time. I mean, think about how many trades you've had that hit a target and then just kept running. Imagine if you would have been able to hold those trades. Chances are if you were able to optimize for that, you might just be a profitable trader with what you're already doing. But these are the small little micro-optimizations that nobody really talks about on YouTube because they're boring, but whatever. Now, the other example you could have gotten into this trade is when we came back up to this point of control. Let's say you missed that first level, and as you can see right here, we closed this candle right above that point of control. So at that point, since we're expecting this to get trapped, we're trying to trade on the right side of the market. We could say that the market's likely trapping all these shorts and we don't want to give them back control. So as you can see, here's the point where they regain control. We've drawn this volume profile from just the top of that swing leg down to the bottom. And then in this example, you got a really nice risk to reward. And the same thing here, you took it up there and you would have trailed up your stops. And, you know, maybe as you progress, you can look to add into entries like this and bring up your stops. Like, for example, let's say you entered that first trade, moves up, you enter it. Once we get that second confirmation, you scale into the trade again and bring up stops again. And this way you can keep the same amount of risk but add to the trade. Now the other entry, which was pretty obvious at this point, or it should be, is when we hit this value area high and closed above it. Now this trade didn't really have that great of risk to reward. Um, I mean, there's nothing wrong with 1:1, but on an opportunity like this when you could have had better entries, that's probably one I wouldn't take. But as you can see, you got many chances to get into this trade. And as you can see, price moves aggressively because this is a move based on traders being trapped all within this range. So you want to think of it again like who is wrong? Because if someone else is wrong, a lot of people are wrong. You're going to be able to make a significant amount of money whenever you're on the opposing side of them, because that is exactly how Wall Street thinks and how they operate. I'll leave a link down in the description where you can get this full board and it's going to be my free community. There's also a ton of other stuff, tons of free resources and stuff to help you with your trading. So if you made it this far, I just want to say thank you guys for watching the video. I hope you guys are enjoying this volume profile content because it's made a huge impact on my trading, mainly because you understand why you're doing what you're doing. And there's a different level of conviction that comes with that rather than just trading patterns. So I'll leave a video up on the screen somewhere. That's a full course to the volume profile. It's like an hour and 40 minutes long. It breaks down all of this logic in case you may not understand some of the basics or prerequisites to trade these strategies. If you could subscribe to the channel and leave a comment down if this video is helpful for you guys, and I'll see you in the next one.










