A trader with ten years of experience breaks down volume profile: the value area and point of control that show fair value, the P, B, and D shaped profiles that signal the next session's direction, and how high-volume nodes reveal where price stalls versus low-volume nodes where it breaks through fast.
Chapters
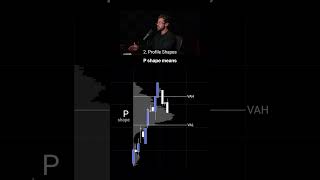
After 10 years of trading, these 3 concepts matter the most. First, the volume profile. Most retail traders look at candlesticks alone, but professionals look at volume at price. It gives you 3 levels: the value area high, the value area low, and the point of control. The range in between is where the market agreed on fair value. But the volume profile gives you more than just levels. The shape of the profile tells you which direction to lean next. Second, profile shapes. Every session between 9:30 and 4 Eastern Time leaves a shape. P-shape means buyers were in control because value shifted higher, so you lean long into the next session. B-shape means sellers won, value shifted lower, and you lean short. D-shape means neither side won and the market was just chopping. You sit on your hands. Third, high and low volume nodes. High volume nodes are where large positions were built. Price slows down there because those positions are going to get defended. Low volume nodes are where barely any trading happened. Price rips through them because nothing is holding it back. That is your trade. Know which direction from the shape, know where to enter from the nodes, know where value is from the profile. If you want to learn more about the volume profile, comment the word join and I'll DM you access to my free course and free community.