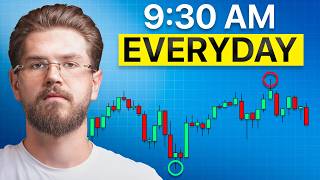
In this tutorial, the presenter walks through a simple, repeatable 3‑step scalping system that uses the first 15 minutes of market volume to define trading levels on a 5‑minute chart. Using ATAS charting software to display a real‑volume profile, the trader marks the value area high, value area low, and point of control. A trade is entered when a subsequent 5‑minute candle closes outside the value area, with direction determined by whether the high or low is broken. The stop loss is placed just beyond the point of control and the profit target is set to achieve a fixed 2:1 risk‑to‑reward ratio. The video demonstrates multiple live examples—both short and long trades—showing quick 15‑minute wins and longer‑duration moves, and then presents a backtest of 50 trades on a $50,000 account that grew to $79,000 with a 62% win rate. The presenter also promotes a free trading community, a detailed volume‑profile tutorial, and a paid mentorship program that promises to help traders become funded within 12 weeks. Throughout, the emphasis is on consistency, clear rules, and minimal daily time commitment (under 90 minutes).
Chapters
I use this stupid simple scalping strategy to grow a trading account from under $10,000 to over $180,000. And I'm about to show you exactly how. It is so stupid simple that even a complete beginner could not mess it up. And the best part is it appears every single day. And in this video, I'm going to teach you all 3 steps and do a backtest to prove to you that it works. Today you're going to learn the first candle value strategy. Now you've seen my results trading this strategy, but the real question is, how can you do it too? Now I want to be clear that trading is risky. I've been doing this for 10 years and you're not going to have these results overnight. But I believe that with a simple and clear system, anyone, including you, can become a more consistent trader. And that is the goal of this video, to make consistent profits using a proven and simple strategy in less than 90 minutes per day. You will learn one stupid simple strategy to find your entry, set your take profit, and set your stop loss. That way there's no more guessing, no hoping, just clarity and execution. To do this, we're going to break it into 3 simple steps. Number 1, mark your levels. 2, we're going to use something called a displacement entry. And 3, managing the trade, which is the most important aspect of any strategy. So the plan for this video is to break down each step, then we're going to go over multiple live examples the last week of trading, and after we're going to do a backtest to prove that this strategy works. Let's get right into step number 1, which is marking our levels. Now I want to be very clear, we do not take trades unless you have hit one of these levels. First, you're going to get to your desk right at 9:30 AM Eastern Standard Time, so New York time. For this strategy, you're only going to use the 5-minute chart. and then you're just going to wait for 15 minutes until 9:45 AM Eastern Standard Time. And the reason for this is because we're going to draw a volume profile on the first 15 minutes of the day. Now, you'll probably notice that I am not on TradingView. I am on a separate charting software called ATASX. And the reason for this is TradingView doesn't have real volume data and ATAS does. So what we're going to do to draw this volume profile is we're going to go over here to the left and you're going to go to the volume analysis, click this dropdown and click the volume profile and TPO. Now next, what we're going to do is we're going to go to that 9:30 AM candle, which you can see is right here. And then we want to take that candle and we want to start and draw the full range until 9:45. Now it's very important, make sure you're using the 9:40 5-minute candle because remember, 5 minutes, and when that closes, it would be 9:45. I got some comments recently on a video about this, so I wanted to clear it up. Now, you'll notice that this volume profile marks some levels. So right here we have the value area high and the value area low. Then we have this red line, which is the point of control. So what this shows you is where the real volume was traded in those first 15 minutes, and it gives you better levels than just using the high or the low of those first 15 minutes. So the levels we're going to use for this strategy are that value area high and that value area low like you see here. But after you've marked this first 15-minute volume profile, that's it. You've got all of your trading levels for the day. And this brings us to step number 2, which is our displacement entry. Now, what we want to watch for to get our entry is very simple. We just need a 5-minute candle closure outside of either the value area low or the value area high. So as you notice in this example, this candle closed outside of the range. Now you might look at this candle right here and think that it did, but remember, this was part of that range forming. So until that candle closed, we weren't looking for an entry. As you can see right here, this candle closed outside of the range. So as soon as this candle closes, we are good to enter the trade. Now to plot out our risk to reward, meaning how much money we want to risk and to find our target, we're going to go over here to the left. And since we broke through the low, we are going to be selling. So we're going to click a short position tool. Now we're going to place our entry right on the closure of that 5-minute candle that closed outside of the range. And our stop loss is very simple. We're going to place it just beyond that point of control, because what this is telling us is that in this first 15 minutes, the market established what it deemed was fair value, which is the area in between this value area low and the value area high. But we see that sellers aggressively pushed outside of that range and were able to close a candle underneath. So if sellers are in control, we don't want them to lose the point of control, which is that red line. And for our target, it's really simple. We just want to go for a fixed 2:1 risk to reward. This means that on our winning trades, we make twice as much as we lose when we're wrong. As you see, this trade only took about 15 minutes to hit the target. And that's one of my favorite things about this strategy, is that oftentimes these trades move extremely quickly when you're right. Now we're going to look at some more examples to make sure you really understand this strategy through and through. But first, I wanted to let you know that I left a link to my free trading community in the description. Inside you'll find the trades that I'm taking and recaps, the volume profile settings and how to set up this charting software, and a ton of free education that can help you as a trader. And just so you know, I'm not cherry picking the examples. I want you to take a look at the date. Here we're on April 7th, so we're going to go to the very next day on April 8th and put this strategy to the test. But first, I want to ask you something important. If you had a proven strategy, are you the type of person to actually stay consistent trading it? Because this, not the strategy itself, is the most important skill that any profitable trader has. And with a strategy this simple, you have everything you need in order to become a consistent trader. So we're going to follow the same boring, repetitive steps and go over here and we're going to select the volume profile. And we are going to click 9:30 a.m. to that 9:45. Remember, we're just marking to that 9:40 candle because it's a 5-minute candle that closes at 9:45. We're then going to wait to see a closure outside the range. So if you notice again, this candle doesn't count because it's a part of the range. After that, we're on the clock. Do we get a closure here? No. Does this candle close outside the range? Yes. So at that time, you would then go and enter a short position because remember, if we break the low, we are looking to sell, you would enter on this candle's closure and you want to put your stop loss just beyond that point of control. And then we're going to go for a fixed 2 to 1 target. And on this trade you hit 61 points. So that was a little over $1,200 per contract. And just to put that in perspective, this one trade got 61 points of profit, meaning you would have had about $1,200 if you just traded one Nasdaq contract. Not bad for a less than 90-minute workday, if you ask me. Now let's hop into the next example. A couple trading days were kind of dead because there wasn't a setup, but that's what a good strategy does. It keeps you out of the market when there isn't a good trade. So here we are on Monday after the weekend, ready to trade at 9:30 a.m. Eastern Standard Time. So we do the same exact thing every single day. And when you realize that trading has structure like this, it becomes a lot less stressful and you and you have clarity on exactly what you're supposed to be doing. So we're going to mark this first 15 minutes, very simple. And once we have that marked, we just wait to see if we get a closure outside of the range. And as you can see with this big candle, we got exactly that. So at that time, since we broke the high, this time we're going to be going long because we want to buy and buyers are in control. So we're going to go ahead and enter the trade right here. We're going to take our stop loss and put it right under that point of control because we don't want to be in the trade if buyers lose control. And then we're going to take our target to make sure we have a clean 2:1 risk to reward. And this trade, you can see, did take a little longer to play out. You would have had to wait until 12:30 for your TP to hit, but still not bad because this trade had 74 points in profit. So you would have had just under $1,500 in profit trading one NASDAQ contract. So now you've learned the full strategy and you saw how it performed over the last week, but In order to have real conviction in this and stay consistent, you need to see real data over a longer duration of time. So let's put this strategy to the test. But first, I want you to pause your screen and take a look at this disclaimer. Now that we've got that out of the way, let's get into the results. So first, let's take a look at the overall equity curve. As you can see, this strategy did produce a couple little losing streaks, and that's normal with all strategies. It's always going to go into a little bit of drawdown. But overall, as you can see, over 50 trades, it performed extremely well. Now, this backtest was done on an account with $50,000 and it ended up at $79,000. In over 50 total trades, it had a 62% win rate. And as you can see over here with the cumulative P&L, which is what we already went over, congratulations, you now have a stupid simple and proven strategy. But if you're anything like me, whenever I was coming up as a trader, chances are you'll get out to the market when it's time to execute and freeze. So instead, if you want to trade this live with me and have every single trade that you take reviewed, be directly mentored by me and learn my simplified full system to trading, then I'll leave a link at the top of the description to apply for my mentorship. Now, I want to be very clear that not everybody is going to qualify due to the intensive nature of this mentorship. But if you do, I guarantee that you will become a funded trader in 12 weeks, or I will personally trade with you until you do. And guys, whether you decide to work with me or not, I'm still going to be posting tons of free value here on YouTube. So make sure to subscribe to the channel. The mentorship is just if you want me to be right there with you, holding your hand and trying to help you avoid the mistakes that I made in my trading career, because it took me 5 years to become profitable. And I had tons of access to content online. And back then, all I wished for was somebody who could have walked me through the process and been there while the market was live. And if you want to learn more about the volume profile, I made a full 1 hour and 40 minute long video that I will leave on the screen for you to be able to click and watch all for free here on YouTube. I go into literally everything there is to know about the volume profile. And thanks for watching the video, guys. Make sure to subscribe and I'll see you in the next one.