
This 5 Minute Strategy Is Boring, But It Made Me Profitable
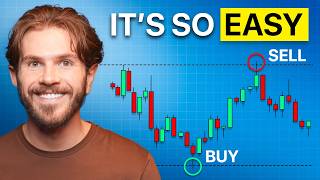
Jesse Rogers shares a mechanical day-trading system using 5-minute charts: mark the first 15 minutes' range, wait for a candle to close outside it, then enter with a 2:1 risk-to-reward ratio before 11 AM. He backtested it on NASDAQ over one year and got a 95% return with a 45% win rate.
Chapters
This boring strategy made me into a profitable trader, and it works so well that it almost feels like cheating. And if anyone would have told me this 10 years ago whenever I first started trading, I would have been able to start getting results like this, this, and this much sooner. So in this video, I'm going to teach you all 3 steps to the strategy and do a backtest of the strategy to prove to you that it works. So why do we want to trade a boring strategy? Well, Well, because in trading, boring plus repetitive equals profitable. And this is exactly how I was able to make over $200,000 from a very small account in just the last couple of months. As you can see here, this is my live account broker statement, but I want to be very clear, it was not always this way. Okay? Like I had to really put in a lot of time to become a successful trader and I struggled for years. And as you can see here, I was still blowing accounts multiple years into my trading journey, back in 2021. And while I can't guarantee you'll have the same exact results that I have, what I can guarantee is I'm going to teach you the exact same system that I use to dig myself out of that hole. Now, I want to be transparent. There is one bad thing about this strategy, and that is that you're going to get tired of it really fast because there's just one setup. You're just trading one single time frame, and you're doing the same thing every single day, no matter what market that you're trading. Now, the strategy is very simple. We're going to break it down into 3 steps. Step number 1 is our range, how we find the trading zone for the day. Step number 2 is our confirmation, meaning which direction we're going to trade. And last but definitely not least is our trade execution. After I teach you the 3 steps, we're going to go over multiple recent examples from the last week of trading. That way you can see this live in action. And next, we're going to go over a simple trick that you can use whenever you have a stop loss to avoid losing days. And finally, we're going to go over a long-term backtest. That way you can see just how powerful this trading strategy really is. Let's hop right into step number 1, which is how we find our range. Now, first things first, you're going to head to the 5-minute chart, and everything you do for this strategy will be done on this timeframe. To start your day, you're going to get to your desk right at 9:30 AM New York time, and you're going to use the same time no matter what market you're trading, whether it's futures, stocks, crypto, or forex. For our first example, we're going to be using May 8th, 2026 on NASDAQ. Next, we're going to wait until 9:45 New York time. So that will be a total of 3 5-minute candles closing from the open. Now a lot of people get this confused and they think they need to wait for the 9:45 candle, but remember, if this candle is 5 minutes and it started at 9:40, then it ends at 9:45. So after these first 3 candles, you've got the range for the day. Now having a trading range is great, but we need to know what levels we're going to trade from inside range. And to find our levels, we're going to mark a volume profile over the range. To do this, we're going to head over here to the left, we're going to click this button right here where it says Forecasting, and we're going to select a fixed range volume profile. And once you've got that tool selected, you're going to click on that first candle and then drag it out over those first 15 minutes. Once you've got that there, we want to double-click this tool and set up the settings. Now this is very important, so make sure you do this exactly as I say. So for the rows layout, we're going to go into ticks per row. Usually it's going to be set on numbers, but you want to change it to ticks and then you want to change it to 1 if you're trading Nasdaq. Now, if you're trading gold or if you're trading ES or another market, you're going to want to change this to 10. Next, we want to make sure volume is set to total and not up/down. and the value area volume is 70. Now, if you want yours to look exactly like mine, you can go to the style and you can set these settings exactly as I have them and make sure that you only have these 3 boxes checked. After this, you now have your trading range for the day. Yes, it is that simple, and you're not going to need any higher time frames or any other levels other than these 3 you see right here. Having a range alone means nothing if you don't know how to trade it, which brings us into step number 2, which is how we find our trade confirmation. But first, I want to ask you an uncomfortable question. Are you the type of person who, if you knew that becoming a profitable trader was achievable, would you be able to stay committed long term? Because if not, no strategy is going to work for you, including this one, and you may as well leave this video. But if you are the type of person to stay consistent, I want you to make a commitment to yourself right now to stick with this strategy for at least 30 days before switching to another one, because most likely you're on a loop of switching from strategy to strategy, and that's why you're unprofitable. The first part of finding confirmation is waiting for a break of one of the value area levels. So that's going to be the bottom level and the top level you get from marking that volume profile over the first range. Now, I know you notice right here we've broken through this level, but this does not count. As a break. Why? Because we need a 5-minute candle closure after the range, meaning it cannot be one of these first 3 candles. It may sound like something small, but this is huge for keeping a high win rate, as you will see later in the backtest of the strategy. So we want to wait until we get that candle closure outside of the range, and as you can see, we got that candle closure right here. So since we broke through the high, we are going to be looking for buys. So in step number 1, we found our trading range and got our levels to trade from. In step number 2, we identified how to find confirmation and the direction we're looking to trade. Now it's time for the most important step, which is how to actually execute our trades, find our stop loss, and place our targets. Now when it comes to execution, we have 3 simple rules. Rule number 1 is we're going to enter on the candle closure through either that value area high, which is right here, or the value area low. Since we closed through the high, we're going to be looking for a long or a buy. Now, to map this out, we're going to go over here to the left and we're going to go back to that forecasting area and we're going to select long position. Once we've selected that, we're going to place that right on the candle that closed outside of the range. Now, this tool helps us map out our stop loss, meaning where we want to cut our losses if we're wrong. And our target, which is where we want to take profit. And this brings us right into step number 2, how we're going to place our stop loss and our target. To map this out, we're going to grab the bottom of this long position tool, and we want to go just down to that point of control, and we want to go 2 ticks under it. And for our target, we want to go for a fixed 2:1 risk to reward. So the way we're going to do this is we're going to grab this level, and you're going to drag it out until you see that number where it says risk to reward. Say 2. Now what this means is that on a winning trade, we're going to profit twice as much as we would lose on a losing trade. And this is extremely important for the profitability of the strategy, as you will see later in the backtest. And rule number 3 for execution is that the entry must happen before 11 a.m. New York time. Now to actually execute trades on TradingView, what you're going to do is you're going to go over here and we're going to click buy since we broke through the high and we're looking for a long. And once we click that, you're good to just go ahead and click buy. And then you want to take your stop loss and you want to drag it down to that level that we set up earlier. And then you want to grab your take profit and you want to drag it up to our target, which is right up here. And now your work is done. You sit back and let the trade play out because after you've done these 3 steps, the market is going to do the rest of the heavy lifting for you. And as you can see, this trade ended up going to the target. And this one trade would have made you $3,900 in a single day. And now that you've seen a picture-perfect example, let's look at an example of what to do when you take a loss and get stopped out. Because for most of you, this is what you need to actually get better at. Now, for our second example, we're on May 7th, 2026, which is literally the day before the last example. So we've got our volume profile mapped out over the first 15 minutes and what we want to wait for is that candle closure. And as you can see, we get it pretty quick. So since we broke through the low of the range, we're going to be looking for sells. Now to map this out, what we want to do is go over here to the left, same place you got the long position, and then we want to actually click the short position. Since we broke through the low, we're looking for sells, a.k.a. shorts. So as soon as that candle closes, you are good to enter that trade. We're going to take our stop loss and we're going to just put it 2 ticks above that point of control. And then we want to set our target for that 2 to 1 risk to reward. So we're going to go ahead and click sell and we're going to enter the trade. We're going to take our stop loss and we want to place it right here. We're going to place our take profit and we've pretty much done all of our work. And like I said, We're going to sit back and let the market do the work for us. And then the market comes up and immediately takes you out. Now, in this moment is where either profitable or unprofitable traders are made, because how you handle losses will determine your long-term success or failure as a trader. So this is how we're going to handle these days. Now, as you can see, the market closed outside the level and gave us everything we needed for a setup. And then it lost. So now what? Well, since we broke through this high and we had a quick reversal right after we got stopped out, we know that we might have just been early and this could be a fakeout. So anytime you get stopped out, as long as you're still in that trading window before 11 a.m. and you get a confirmation in the other direction, then you are good to enter the trade. Now, I want to be clear, if you had gotten two confirmations on sells, you wouldn't take it. So you only give yourself one loss per direction. Oftentimes you'll see that if you lose the first trade and then you get a confirmation in the other direction, that trade ends up being a winner. So it's the same setup. You would put your stop loss under the point of control and you would target 2:1 risk to reward. And this is the hardest part. You have to trust in the system even though you ended up taking a loss on that first trade, because any strategy is going to have losses, guys. How you handle them is what's important. Now, as you can see on this day, we only made a few hundred bucks, but this is much better than a losing day. I want you to imagine for a second if all of your losing days that you had, just half of them could have been a break-even day. That alone, for most of you guys, would have made you a profitable trader. Now, you've seen a couple examples over the last week, which is great, but we need to see this strategy's performance over a longer term. So let's put it to the test. This backtest was done from May 2025 to May 2026, and it was done on NASDAQ, and it allowed for reentry just like I showed you in that last example. And there was absolutely no discretion used on this strategy. It was the mechanical steps that we just went over. And as you can see, this strategy had a 95% return over just one year. and it did that by only having a 45% win rate. Now, a lot of you guys might think, oh my gosh, that sounds terrible. But for one, you can see the actual dollars, which is all that matters in trading. And for two, let's break down the money math behind profitable trading. If you risk 1 unit per trade, assuming your winners are 45% and you go for 2R and your losers are 55% and you lose 1R on a trade, then we have a total of 0.9 minus 0.55, which gives you an expectancy per trade, meaning how much money do you expect to make over 100 trades per each trade, accounting for wins and losses of 0.35R. So simply put, if you were to make 0.35R on each trade over a large sample, let's say you're risking $100, well then your expected value is $35 per trade and over 100 trades. Statistically, that would be about 35R. Now, if you are risking 1% of your account, that would mean over 100 trades you would make 35% of your account. These are some pretty insane numbers for such a simple strategy. And now you have this proven strategy. But if you're anything like I was whenever I was still learning, you'll likely still trip up when it's time to go out and execute on this strategy. And that's exactly why I structured my mentorship the way I did. And I'm so confident in this system that I guarantee you will become a funded trader in 90 days, or I will personally trade with you until you are. Now, the reason I'm so confident in this is because we're going to literally be sitting down together while we're trading at the market open. You'll also get access to my full AI trading system, and every single trade that you take is going to be reviewed by your coach. You're going to get access to me and tons of other profitable traders and pretty much learn everything that I have went through in my 10-year-long trading career. At the top of the description of this video, you will see the link where you you can go and apply. And yes, you do have to go through an application process because as you can see, this is a very direct and intensive mentorship and we can only take on so many traders at one time. Now, I want to be clear that regardless if we work together or not, I'm still rooting for you to win and I'm always going to post free value here on YouTube. The mentorship is more so just a fast track and getting to sit with me while we implement what I'm teaching you here on YouTube. I always like to put it, YouTube is information, and if you want to work with me directly, that is me helping you implement the information you've learned. Because whenever I first started out trading, I just wished I had somebody who would actually sit there with me and trade. So I built that once I became a successful trader. Thank you guys for watching. As always, make sure to subscribe to the video. And also I'm going to leave a video here on the screen that you can watch to learn more about my strategy and the way that I trade. Again, thanks guys, and I'll see you in the next video.










