
Watch Me Day Trade LIVE Using Volume Profile (I SIZED UP)
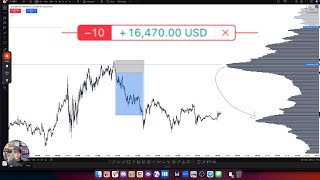
Jesse Rogers trades live using volume profile, identifying a sniper entry with market-structure shifts and order-flow confirmation on Bookmap. The trade netted $16,000 on 10 contracts. He explains point of control, value nodes, and how to spot edges on five-minute charts.
Questions this video answers
About $16,000.
10 contracts.
Five-minute chart.
January 6, 2026.
Mark the last five full days or the current daily swing leg (he chose the daily swing leg).
Chapters
What's going on, guys? So I'm gonna make this video just showing you how I was able to take this trade today, which netted me about $16,000 in profit. And I'm gonna break down why I took the trade and how I got this entry, which in my opinion was a sniper entry. And just walk you through every single step. That way you guys can find some trades just like this. So when we look at this trade, the first thing I want you to pay attention to before anything is this volume profile over here to the right. Now, if you're not aware of what a volume profile is, don't be intimid. It's extremely simple. All this shows is the level of volume traded at different price levels. The bigger these mountains are, the more big players in the market are positioned at this level. Okay, so that's something that's very important to remember. Now, if you see this says poc, that means point of control. This means this was the highest amount of volume in this profile. Now, whenever we look at the volume profile, it can tell us multiple things. Number one, again, where the largest players are positioned. Another thing it can tell us is where the market moves so fast, where there are very low amounts of volume. Now, whenever the market moves into these lower volume nodes, which are the valleys, and then this is a high volume node, the mountain. When the market moves on one side of the mountain, that is where the best opportunities are going to form. So these are just types of ways to find key levels. So every time the market hits into one of these areas, if it kind of deviates from one side and then rejects, that's, that's going to be a good trade setup. Because what this is telling us is that the larger market participants are defending their positions. We want to look at these valleys as areas where the larger market participants are going to be defending their positions. Now, when we look at this chart, what we can see here is that there was a very high volume node, in fact the highest one. That's why it's the point of control right here. And we saw the market trading up into this level. Now, once the market trades into this level, and I'm on a five minute chart here, we can watch for the reaction of any sharp move that goes to the edge of value. Now, what do I mean by the edge of value? Well, if you just take a line and ask yourself, where does this shelf start? Like, if this was a book, where could you set a book? Like, where's the end point? We could send a book off, right? Is Right here, that's where a book could sit. So if we take a line and mark out that level right there, we'll just take a horizontal line tool here, we'll mark it right there. You'll notice that that's right here where the market hit into. Now what we always want to see and what a lot of people will mess up with this is they'll think oh we're breaking out. You know, you're getting a big candle into this level. You, that's going to be the trap a lot of the time. Now if the market hits above this and stays there for a long time, that means that the market is getting accepted there. So for example, let's just say if there's a, if the sellers are in control and the sellers are positioned here, which we can say that, you know, if we look over here to the left hand side of the screen yesterday or I guess Friday's price action, the last trading day, we saw a big sell off. We can see that there were a ton of, of traders position in that area. Now this, this volume profile is anchored more than just yesterday. I'm going to show you later how I anchored it. But the point that I'm trying to make here is we can establish where the larger players are in control. So if there's a larger player that's been positioned here or many larger players, do we think that they're going to let the market move much above them? If they intend to push it higher? No, they're not. And these low volume areas usually are going to provide very aggressive moves. So I want you to remember that the low volume areas, think of it like you're on a car and it's going downhill. Now what happens when the market is moving very aggressively? Well, retail traders are going to want to jump in the market right now the market's response to that, that aggressive buying or aggressive selling tells you everything you need to know. Because we have to ask ourselves, does a big market participant step up and offer them? Okay, so for example, let's say right here the market started moving and there's a lot of aggressive buying and we came up into this area. Well at this time, if you guys remember this morning, this was moving pretty aggressively. Okay, if we look at this and I posted this in the discord, I said watch 25, 700. Look where this level is. It's 25700. Now if we look the market was moving really aggressively because volume is starting to thin out. Now we have to ask ourselves if there's a Lot of herd mentality, a lot of aggressive buying. Right. Does a large market participant, like the big dogs or smart money, whatever you call it, do they come in and sell to them? And the way we can determine that is just by price action. Now, with this exact trade, if we look where I got my entry, you can see that it was very simple. We're just using a key level and then I'm using the same exact tools that you would use to enter any other trade. Right? So we have an inverse fair value gap right here. We also had a market structure shift and there are numerous different ways you could take this trade. Right. We had change in the state of delivery, however you want to look at it. It's just all these things are the same thing. They're just a confirmation, right from a key level. And these volume profile levels are based on data, so you know that they're going to be strong levels. So when you see these reactions from them, it's going to give you a much more confident take on why you should take that trade. So when we look at this trade again, we can see that we came into that lower volume area, we came on the shelf, and then immediately the market responded very aggressively and started selling off to the downside. Now why did I take the trade to where I did? Well, whenever you are trading from one high volume node and you see a rejection here, you want to, you could understand at that point that sellers are in control. So, so when you understand the overall regime, meaning we're moving down, well, where are we going to move down to? Well, you have a couple of these little higher volume nodes and then really this shelf right here, as you can see right here, is where the market ended up pausing. Because again, once we come to the edge of value here, if there are buyers that are going to try to defend this area, that's where they're going to do it. Now you want to think of it like these lower volume areas are areas where smart money or the larger market participants didn't get in the market because there's low volume. So they have it traded at these areas. And if the market moves down to these areas like this, like if we would just move through this. Oops, wrong tool. If we were to just move through this and blast through it, best know the market's going to move really, really harsh. Right? That's why I didn't just take a full profit, I actually had a trailing stop. Because if the market does break through here and then actually get accepted, not just break through like you saw up here, but it breaks through. Like let's just say here is our level or just hypothetically it would have been a little bit higher. And then let's say the market went under it, but it stayed there, right? Just kept staying there, made more legs down. Like that would be a confirmation that this high volume node was not being defended. And this low volume that I should say is not being defended. And we're likely to move down lower to areas of higher volume. And again, you just look at this like a roadmap. Like it's like if you're trying to ride a bicycle, you want to know are you going to have to ride up a mountain? Are you going to get to ride down a hill? Right now you do need to understand the regime like which who is in control? Buyers or sellers? And you're going to do that by just interpreting the way the market reacts to these key levels just like you do with anything else. It's the same thing. A lot of people overthink this and cheat themselves out of a life changing tool. Because I can tell you guys, I've been trading for nine years, Volume profile is not necessarily what made me profitable, but I've been using it pretty intensely and it's very powerful. It's very, very powerful. It gives you a lot of data and it gives me a lot of conviction. As you guys have seen, I've sized up tremendously. I mean this, you know, this trade I was risking around. What is this? I was 10 contracts, it was around three to $4,000, I'm sorry, four to $5,000 to make 16,000. Which, you know, it's not a crazy amount of money but for, you know, about, I don't know, it was like 20 or 30 minutes, not a bad workday if you ask me. But using these tools has given me a little bit more edge and more confidence in taking those aggressive entries. That way I can get good risk to reward. And also again in the overall levels that I'm using. Now another thing again on top of this, even if this wasn't the point of control, then I would have still look for this trade because it was a shelf, but on top of that it was the point of control. So that is another thing is that it was the area where the highest amount of volume had been traded. Now the way that I got this tool, these are the settings. You guys can pause it, screenshot it if you want. These are, oops. These are the settings I use and the way that I anchored this, you can do this in two different Ways you can mark this on just the last five days or you can mark it on the current daily swing leg. The reason I marked it over here is because the last five days accounts for the holidays. And I didn't really like that data because I knew a lot of commercials and institutions aren't really trading at that time. So. So I drew it on this just daily swing leg right here because this is the most recent leg in price and included all of that. And if you, if you look, it's not going to change a tremendous amount. Like it will change if I go the other way you can do this is go 1, 2, 3, 4, 5, like mark the last five full days. And you can see that it's, it's probably not going to change tremendously. In fact, actually it did not change the point of control at all. So a lot of these things, people overthink, like with settings and, you know, all this stuff. But it comes once you understand what you're looking at. You're just marking a bigger range and just seeing where was the volume traded, where were the biggest players position and are those areas getting defended. That's literally it. Now, as a little bonus right now, if you guys have made it to this part of the video, then you guys are probably dedicated and committed. And I can show you some cooler stuff because a lot of people turn off mentally to this stuff and again cheat themselves out of a really good tool because they think it's complicated. But as with anything else, I'm pretty good at simplifying stuff. Now I want to show you something called bookmap. And when you look at this, you're going to want to throw up at first. But just understand, guys, this is, you don't need to know a lot of the stuff this is showing you. And it looks way more complicated than it is. All it's showing you is that at these darker areas, this was where there was a wall of limit orders. We always want to look at it as the larger market participants are going to trade using limit orders. Because if they use market orders, their fills are going to be very poor and they're going to lose money immediately when they trade. A lot of larger trading desks can't even get into the market by using a market order. So they need to use limits. Now in order to fill a limit order, there has to be aggressive buying or selling. So aggressive. When I say that, I mean market people hitting market buy. And that's what you see in these bubbles right here. Now this is showing you the. I don't know why it's not loading. It should have more data on that little white area of it. I don't know why it's not showing. But anyways, essentially this is showing you where there are more aggressive buyers or aggressive sellers, obviously, green and red. Okay, so if we look at the time where I entered that trade, which was over here, what you want to look for. And again, we talked about this up here. We want to look for larger players defending their trade. So what does that mean? Well, we want to look for larger players who enter via what limit orders. And if we want to see them getting in the market defending their trade, what do we want to see moving into it? We want to see market orders. We want to see aggressive retail traders aggressively buying here, and we want to see them not rewarded. Now what I mean, when not rewarded is just what you guys look at already as confirmation. So a liquidity sweep, for example. Right. Like if we have a lot of aggressive buying and the market's not continuing and it's moving aggressively away from it, that is called absorption. Okay, now absorption just mean that all these retail traders are getting exactly that, they're getting absorbed. So if we look at this chart and we look right at that 1150 ish time, which was right around here, I was watching this as it unfolds. And if you're wondering why this doesn't have time frame, this is just tick by tick. The, the time frame is just, you just scroll. It's just showing you all of the data as we can see all throughout this range. Like if I zoom out just a little bit here and kind of make this a little smaller, it'll aggregate the data a little bit differently and make this just a little bit bigger than that. So if we look right here around this 1150, we can see that the market was hitting into a lot of these sell walls, if we will. Okay, an offer wall or however you want to name them. We're getting a lot of aggressive buying. The market kind of sells off. Right? We're getting aggressive buying. Again, aggressive buying right here into this cell wall. And as soon as I saw this, as soon as I saw this aggressive buying, there's a lot of aggressive buying. And it wasn't getting rewarded. When I say it wasn't getting rewarded, I mean there was people aggressively entering the market at an area where I'm looking to sell already. That's the important thing. I'm already looking to sell. Now if you look at and zoom out, there's a lot of aggressive buying here. And it's not rewarded. Then you see very small amounts of selling and what happens, it's rewarded. Now, right around here is what you're seeing with that market structure shift. So notice how many green bubbles you saw that didn't push the market upwards. And, and it didn't take much to push the market down on the sell side. So what that shows you is that there is an imbalance of buyers and sellers. That's what you're trying to see through market structure. That's what you're trying to see through everything. So as we see this and we see that the market's responding to selling, we have a key level, so we have context of why this matters. And I want to be very clear on something, guys. All this shit means nothing if you're not looking at the right time and the right level, okay? The only reason any of this mattered is because I'm looking at this level. If I wasn't looking at a good level, it would not matter. So whenever we hit in that level, we can see that aggressive buyers are not in control, and aggressive sellers are in control. And we see price confirm what we're seeing through that kind of data, through these market structure shifts and through all these inverse fair value gaps, that is where I had the confidence to enter the trade. And you could see I entered the trade in this candle. If we go back to Tradezilla, you can see right here, I entered in right there, right at the base of this. And that was after we had a market structure shift, after we had an inverse fair value gap. Multiple inverse fair value gaps. So this may seem like a lot, but I want you guys to watch this video a couple of times and understand that this stuff may seem complicated, but all you're trying to do is two things. You're using this volume profile to establish levels. You're literally looking at a fucking mound of bars and saying, where does the shelf begin? On each side. That's all you're doing. You're looking at those as levels. Once price hits that, you're looking for a reaction just like you do with liquidity sweeps, just like you do at the first candle rule, just like you do with any good trading strategy. So don't overthink it. Understand that you can make complex things very simple by breaking them down into their own little sections. Okay? So everything comes down to one of two things in trading, key levels or confirmations. So a key level could be liquidity, it could be the point of control, it could be the high volume node, the shelf, it could be a lot of things, but you're just looking at an area that is interesting to you. And once you trade from one area that's interesting to you and you get that confirmation, which could be any of those market structure shifts or anything, you're going to go from one key level to the next. That is day trading. My guys, like, it's not that. It's not that crazy. Just don't make it harder on yourself than it needs to be. So hopefully this was helpful for you guys. This is a little bit more of a raw format. So comment on this and let me know if you, you like these kind of videos and I'll keep making more of them because they're really easy for me. They're really fun. And to be honest, I think that these are more valuable to you guys than the whole, like, typical YouTube pizzazz, you know, for retention and everything. And, you know, it's. It's nice for a change to make these. So as always, guys, let me know if there are any questions and leave a comment if you want to see more content like this. See you guys later.










