Learn to track your golf stats in a Google Sheets template that flags your best and worst metrics month to month. Input six key numbers from your Circles account, use shortcuts to see what improved or declined, and build a practice plan around the gaps.
Chapters
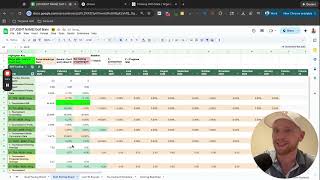
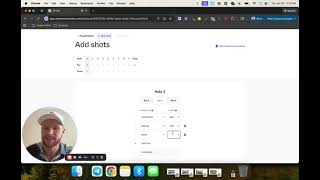
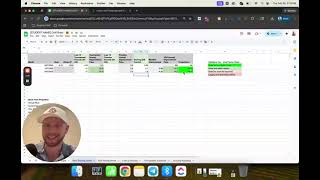
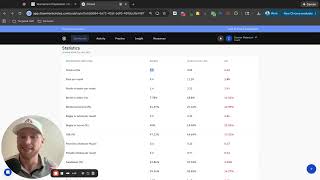
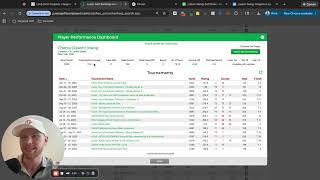
Alright, so in this video I'm going to be going through how to read your statistics and also update them on a monthly basis. This is really what you're going to want to do to be able to see consistent progress, to actually see where your game's at, how it's trending over time. So, um, if you do not already have this, um, in the Google Drive folder that I've sent you, you can just go to File, Make Copy, and then you'll have your own. You should have your own, but if you don't have that file, make copy there. So this is what you're going to be filling out here. I have a filter on this, so everything that's just capital I space dash and just hit select all, that's going to give you all these fields you need to update. You don't need to update the ones in yellow here, just the stuff in green. So I'm going to be using a player to, um, to track this stuff. So what we're going to do is I'm going to go into his Circles account. I'm going to look at this last month. So I'm going to say 1, 2, 3. So he played 3 rounds and they were all tournament rounds. Didn't have any practice rounds. Then I'm going to go in here and I'm going to scroll down to Off the Tee Detailed View. I'm going to pull his penalty rate. So that's 2.17. Then I'm going to grab greens regulation, 72.78. Then I'm going to grab his scrambling, 45.83. Then I'm going to grab the 3-putt rate, which is 5%. Then I'm going to grab the birdie conversion rate, which is 22.9. And then I'm going to grab the tournament scoring average, which is 0.8. Okay, and what you'll notice here is we have conditional logic for each one of these values here. So like over 70% is really, really good, it's bright green, knowing that like, hey, this could revert on us a little bit. Our highlighted here is our birdie conversion rate. That's the main place this player needs to focus based off of this set of statistics here. In his case, he doesn't have any tournament or any practice rounds, so we're just going to leave that blank. Now for the next month, what you need to do is you highlight this whole thing and then just drag it to the right here. Okay, so let's just say, you know, these statistics changed on us a little bit, right? So we revert to 70% here. Let's say we improve penalty rate off the tee, you know, let's say scrambling stayed about the same, let's say we improved 3-putts and we improved our birdie conversion rate in this particular case, and we also improved our approach play here. So in this case, let's just, for the sake of simplicity, we're at 71%. The focal point is still birdie conversion rate, but there's that improvement here that we're seeing. Now if you go over this little filter, here's the cool thing about this spreadsheet. If you go in and you type P- select all here, we're going to see the progress rate month over month for each one of these statistics. So in this case, penalty rate went from 2.17 to 0. We're going to see that right there. We saw greens regulation went against us a little bit, we're going to see that -1.78. Scrambling got a little bit worse, 0.83. 3 putting improved a little bit, 2%. Birdie conversion rate improved a little bit, 1.1%. Tournament scoring average improved by 0.8 shots, so that's better. Projected scoring average improved by 0.6 shots, and compound errors improved by 0.2 shots. So all this allows us to see not just what our statistics are but how they're trending over time. And as you guys can see, as you add more and more data in here, it'll tell a more and more clear story about the places in your game that are improving consistently and the ones that are potentially lagging. It allows you to see all of that in one place. So I really want you guys to take advantage of this, but this is how you really want to not only pull your statistics but actually be able to do something with them. Um, and then I'll be taking this the next level when we build out your practice plans. So just DM me when you are ready for me to actually dig through your data, but I want you to actually go in here and do this manually. I will obviously check your work, but that way you can actually see how your game is trending at these different levels as well. So once again, just go in here, clear this out, get your basics here. Another thing, just so you guys know, if you type C and then dash and then select all, You can see how these particular statistics compare to practice. So this player actually had practice statistics. We would see how these are different versus practice. So it's not really relevant for this player, but if you're playing both practice and tournament rounds, which is what I do recommend, then you'll be able to see that as well. So you'll be able to see your core statistics that'll be conditionally formatted and you'll be able to see the progress rate for those statistics month over month, and you'll be able to see how your tournaments are comparing to practice, where there's some potential opportunities there. So let me know if you've got any questions with this, and go ahead, get started on using, uh, using the spreadsheet.