Is Scottie Scheffler The Next Tiger Woods?

Connor Stirling Peterson compares Scottie Scheffler's 2024 stats to Tiger Woods' peak seasons using five core metrics: penalty rate, greens-in-regulation, scrambling, 3-putt rate, and birdie conversion. Scheffler's expected scoring average of 68.55 matches Tiger's historic peaks. The real question isn't talent but whether Scheffler can sustain that dominance for a decade.
Chapters
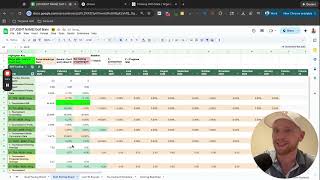
Is Scottie Scheffler the next Tiger Woods? What's going on, guys? I wanted to make this video to provide kind of a different perspective on this kind of question, this line of thinking. Obviously, Scottie is just completely dominating the golf world right now, and so I thought it would be fun to use this as an example to help you guys understand statistics a little bit better and how you can use statistics, or your junior golfer can use statistics, as they develop their own game. And so what I'm going to do in this video is I'm going to break down Scottie's statistics, I'm going to break down Tiger's statistics, and then I'm also going to even go through Rory McIlroy since he's kind of like the last guy that's taken on that kind of Tiger-esque role. Obviously Tiger's incredible and there's probably never going to be anyone quite like him, um, in his overall dominance, but Scottie's given him a decent run for it. If you enjoy videos like this, then go ahead and leave this video thumbs up and subscribe to the channel. So without further ado, let's go ahead and hop into this. And this is how I want to start this. Now, this is a spreadsheet that I give to all my students, but it breaks down what I consider kind of the 5 most important statistics that we should know. And that's penalty rate, greens in regulation, scrambling, 3-putts, and birdie conversion rate. Now, there are a bunch of statistics that go underneath these that can add clarity that are definitely valuable, but I found these to be the most descriptive. And if you just told me these numbers about a player, I can pretty much tell you what they're going to shoot. And so I'll just kind of line out these numbers for you. So these are 3 different players. This is, you know, and so if you guys were just to look at this for a second and say, all right, based on these numbers, who is the best player out of this group? Who has the best game? Because you should be able to look at statistics and say objectively, this data set is the best. And so I'll give you guys just a second, pause the video, think about it for a second. Which one of these do you think is the best? All right, well, I'm hoping you said this one because you should have seen expected scoring average 68.55 and an actual scoring average of 67.61. And so this data set right here, these numbers, these are Scottie Scheffler's current numbers for this season. These numbers are Tiger Woods' numbers from 2000, and these numbers are Rory McIlroy's numbers from 2014, the last year that he won two majors. And so when we kind of look at these numbers, I want you guys to just take a second and kind of take that in. Because you should probably notice a few things in common here. You're gonna notice both Tiger and Scottie have greens regulation that is higher than 70%. They scrambled very well. Every one of these players avoided 3-putts extremely well, and they all made a decent number of birdies with essentially no penalty shots. For the most part on the PGA Tour, guys don't hit it out of bounds, and so that's going to be kind of a wash across the board. But that is— that's what these data sets look like. And so we can objectively say if Scottie stays on this level, he might be giving Tiger a run for it. Now I wanted to kind of dig through this a little bit deeper and kind of go into why I, I understand the value of strokes gained, but I don't love it as a metric. So let's just go ahead and do this. And this isn't going to be perfect here, so I'm going to have to compare Scottie and Rory since Tiger Actually, let's go ahead and do this because Tiger— Tiger's got 2006 here. Let's go ahead and do 2006 because we've got strokes gained data on that. It's going to be something ridiculous, 3 shots gained or something. All right, so let's go ahead and update these numbers just so we're comparing apples to apples as close as possible. 74.15. All right, and then go ahead and grab his scrambling, 62.81. Look at his 3-putts, and he's got 3.31. And we've got, let's see, birdie conversion rate 35.26. All right, perfect. And then let's just also go ahead and grab a scoring average just so we have that, 68.73. And so these numbers at the bottom here, they're actuals. This is what my model is predicting that they would shoot. Now this is based on a 70 72 golf course. They're playing some 71s, some 70s. So all I'm trying to get is close enough here, but we can kind of see apples to apples now. You know, Scottie is definitely, you know, playing at an extraordinary level. But now let's kind of go into the piece that I wanted to show you guys. So if we look at strokes gained across the board, Scottie's off the tee, he's gaining 0.9 shots. Um, let's see here, on approach he's gaining 1.34 shots. Let's see, around the green he's gaining— we're gonna give him 0.54 shots. And putting, he's not really gaining anything, he's 0.01 shots. For a look at Tiger, Tiger is gaining 0.8 shots off the tee, so not quite as good as Scottie. He was gaining 2 shots into the green, he was gaining 0.49 shots on the greens. And then let's see where he was at around the greens— 0.1 shots around the green. So again, nothing too crazy here. And you can kind of see that, you know, between Tiger's short game and, you know, Scottie's putting, they're about— they're about a wash there. Scottie's maybe doing a little bit better off the tee, um, and then, you know, looks like Tiger is obviously a little bit better on approach. But again, these are very, very similar, um, numbers, and I, I think if anything, I would give the edge maybe to Scottie just a little bit. Um, it— he's probably hitting it closer considering his 3-putt rate's a little bit better. His birdie conversion rate is better, and he's hitting more greens. And so if we're just to compare those two data sets there, this is kind of to me where I don't really love the, you know, the strokes gained metric. I don't think it's, it's showing a ton here, but, you know, Scottie's objectively playing really great golf. And so an example of this would be, you know, by every instance, you could pretty much say Scottie's ball striking is probably better than Tiger's was in 2006. Um, maybe we have to normalize for some conditions there, but they're at least very, very comparable. But but if we're just looking at pure strokes gained, then Tiger is 0.7 shots better, which I don't think is accurate. And so I think it's a lot more accurate to look at these numbers and say, okay, well, you know, what's the greens hit, what's the birdie conversion rate. That's going to kind of spill into your make rates on the greens and proximity. Let's just go ahead and do that real quick. And I know this video is a little bit looser, but hopefully you guys are enjoying kind of the thought process that goes through this. So 35 feet proximity. Um, that doesn't tell us a ton. We want to see approach shots here. So 22 feet, 21 feet, he's actually closer from 170, 150, 175 versus 125, 150. So he's obviously really, really good there. But also makes a ton of sense because we're hitting a lot of shots from, from these distances here. We're not hitting a ton of shots here, but he's really good with his wedges. All right, and then longer stuff, 32. How is— how does that compare to Tiger? So Tiger, 21, same like Scottie. Drop in performance here, 23. Pretty solid with his wedges, pretty solid with his longer stuff. Looks like he's a little bit better on the longer ones than Scottie is right now. Scottie's a little bit better with the wedges, it seems like. So again, if we're comparing these two data sets just from like, you know, proximity, greens and regulation, all that stuff, I would say that these are pretty comparable ball striking performances. And I think that the metric of saying that Tiger is, you know, 0.7 to 0.8 better is just not super helpful or accurate. And so that's when I work with my students I don't really go based off of the strokes gained, um, perspective. I go off of this perspective because I think it's a lot more helpful in development here. Now I'll pull in Rory as just kind of the last one. And you know, this is obviously an amazing season by Rory, but that just shows you how good Tiger and Scottie are playing. You know, same thing here. Let's look at driving. So he was gaining 1.37 off the tee, fine. On approach is 0.6, so a decent stretch from Tiger and Scottie there. Around the greens, pretty mediocre. And then on the greens, fairly mediocre. So again, it's not the end of the world, it's not the worst thing ever. And certainly Rory probably has the the worst setup here, and these are obviously all great seasons, but I hope this is helpful for you guys to kind of visualize the, the stats that have the biggest impact on, on where your junior golfer is at. And so if we ask ourselves a question, you know, is Scottie the next Tiger? Well, the question is, can he do it for another 10 years? You know, that's, that's what Tiger did. And so if you can do that, then that'd be amazing. But is he playing the level of golf that Tiger was and probably, you know, 2000, 2001, 2002. I don't see how you couldn't say that he is. Um, he's, he's absolutely dominating, and, and this is the formula behind it. So when you have your junior golfer, you want to be thinking about how do we get greens in regulation as high as possible? How do we eliminate 3-putts? If we can do those 2 things, it's just going to be really, really difficult to shoot bad scores. Now I'll just show you guys this real quick. If we have a scoring average of 68.55, let's take scrambling down to 50%. It just doesn't impact the score that much. Like, maybe, maybe a shot, it looks like. So we just dropped 20% performance in scrambling. So a lot of people might look at Scottie and be like, oh my God, his short game is so good. But I mean, he's just ball striking these golf courses to death. And if he's not 3-putting and he's making a few putts, he's going to be in a really amazing spot. So hopefully this was helpful for you guys in understanding statistics a little bit better, how your junior golfer can implement this in their game, and also just kind of understand what the guys are doing at all points in time. You know, this is 2024, this is 2000, this is 2014. You can see the, the game of golf is in as good of hands as it it ever has been. Um, but it also kind of shows you guys like what the elite players have always done. They're going to hit a ton of greens, their scrambling is going to be pretty solid, they're not going to 3-putt at all, they're gonna make a ton of birdies. And they're gonna make a ton of birdies in part because they're gonna hit close, they're gonna make putts, and that's where the guys are going to focus. Now in future videos, what I'll do is I'm going to dig through kind of a progression plan for junior golfer based on their statistics. Um, but this is the end game. Like, this is as good as you can do it, and this is what it looks like. So if you want to help your junior golfer model things out for themselves, this is what they should be striving for. So I hope this video was helpful for you. Leave a comment, um, your biggest takeaway, like it, and subscribe to the channel if you enjoyed this and want to see more videos like it.